Computerized macular pathology diagnosis in spectral domain optical coherence tomography scans based on multiscale texture and shape features
- PMID: 21911579
- PMCID: PMC3208114
- DOI: 10.1167/iovs.10-7012
Computerized macular pathology diagnosis in spectral domain optical coherence tomography scans based on multiscale texture and shape features
Abstract
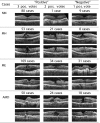
Purpose: To develop an automated method to identify the normal macula and three macular pathologies (macular hole [MH], macular edema [ME], and age-related macular degeneration [AMD]) from the fovea-centered cross sections in three-dimensional (3D) spectral-domain optical coherence tomography (SD-OCT) images.
Methods: A sample of SD-OCT macular scans (macular cube 200 × 200 or 512 × 128 scan protocol; Cirrus HD-OCT; Carl Zeiss Meditec, Inc., Dublin, CA) was obtained from healthy subjects and subjects with MH, ME, and/or AMD (dataset for development: 326 scans from 136 subjects [193 eyes], and dataset for testing: 131 scans from 37 subjects [58 eyes]). A fovea-centered cross-sectional slice for each of the SD-OCT images was encoded using spatially distributed multiscale texture and shape features. Three ophthalmologists labeled each fovea-centered slice independently, and the majority opinion for each pathology was used as the ground truth. Machine learning algorithms were used to identify the discriminative features automatically. Two-class support vector machine classifiers were trained to identify the presence of normal macula and each of the three pathologies separately. The area under the receiver operating characteristic curve (AUC) was calculated to assess the performance.
Results: The cross-validation AUC result on the development dataset was 0.976, 0.931, 0939, and 0.938, and the AUC result on the holdout testing set was 0.978, 0.969, 0.941, and 0.975, for identifying normal macula, MH, ME, and AMD, respectively.
Conclusions: The proposed automated data-driven method successfully identified various macular pathologies (all AUC > 0.94). This method may effectively identify the discriminative features without relying on a potentially error-prone segmentation module.
Figures


References
-
- Liu Y-Y, Chen M, Ishikawa H, Wollstein G, Schuman J, Rehg JM. Automated macular pathology diagnosis in retinal OCT images using multi-scale spatial pyramid with local binary patterns. International Conference on Medical Image Computing and Computer Assisted Intervention. 2010;6361:1–9 - PMC - PubMed
-
- Canny J. A Computational Approach To Edge Detection. IEEE Trans Pattern Analysis and Machine Intelligence. 1986;8:679–698 - PubMed
-
- Wu J, Rehg JM. Where Am I: Place Instance and Category Recognition Using Spatial PACT. Presented at IEEE Computer Vision and Pattern Recognition 2008, Anchorage, Alaska, June 2008; New York: IEEE/Wiley; 2008;1–8
-
- Ojala T, Pietikäinen M, Maenpaa T. Multiresolution gray-scale and rotation invariant texture classification with local binary patterns. IEEE Trans Pattern Anal Mach Intell. 2002;24:971–987
Publication types
MeSH terms
Grants and funding
LinkOut - more resources
Full Text Sources
Medical

