. 2011 Nov;60(11):2954-62.
doi: 10.2337/db11-0358. Epub 2011 Sep 12.

Potential role of regulatory T cells in reversing obesity-linked insulin resistance and diabetic nephropathy

Affiliations

Potential role of regulatory T cells in reversing obesity-linked insulin resistance and diabetic nephropathy

Kathrin Eller et al. Diabetes. 2011 Nov.

Abstract

Objective: To assess the potential role of FoxP3-expressing regulatory T cells (Tregs) in reversing obesity-linked insulin resistance and diabetic nephropathy in rodent models and humans.

Research design and methods: To characterize the role of Tregs in insulin resistance, human visceral adipose tissue was first evaluated for Treg infiltration and second, the db/db mouse model was evaluated.

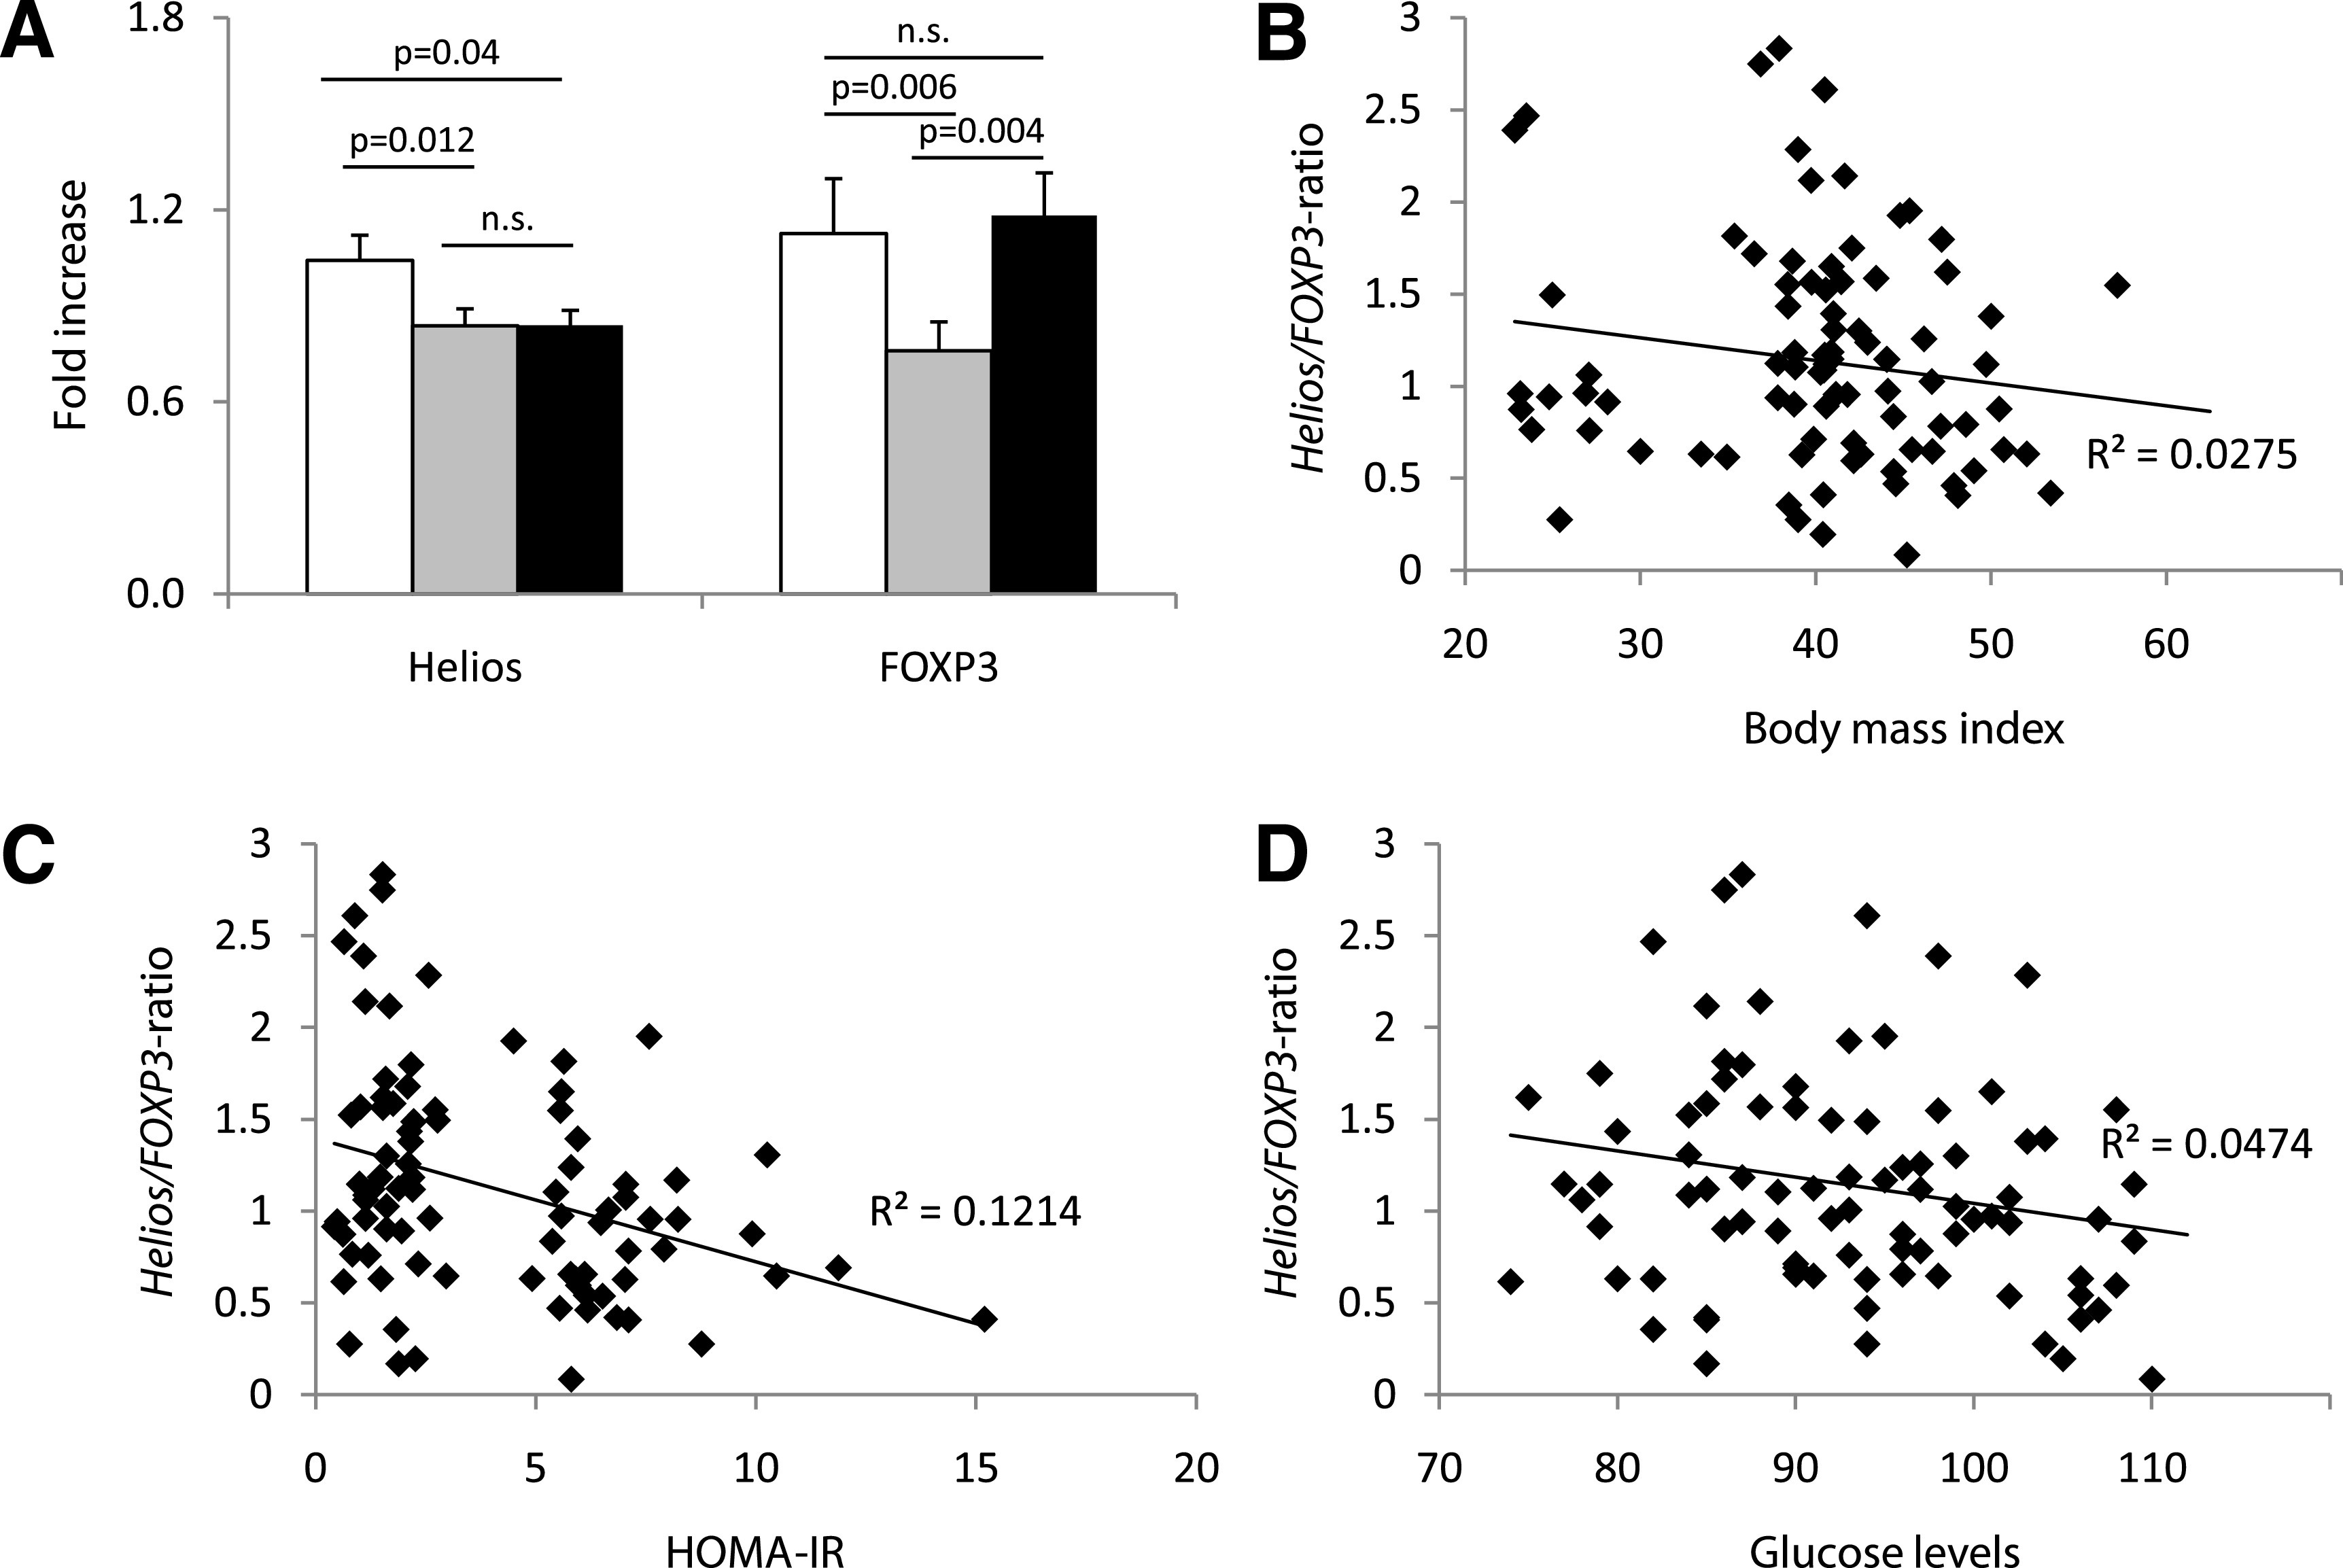
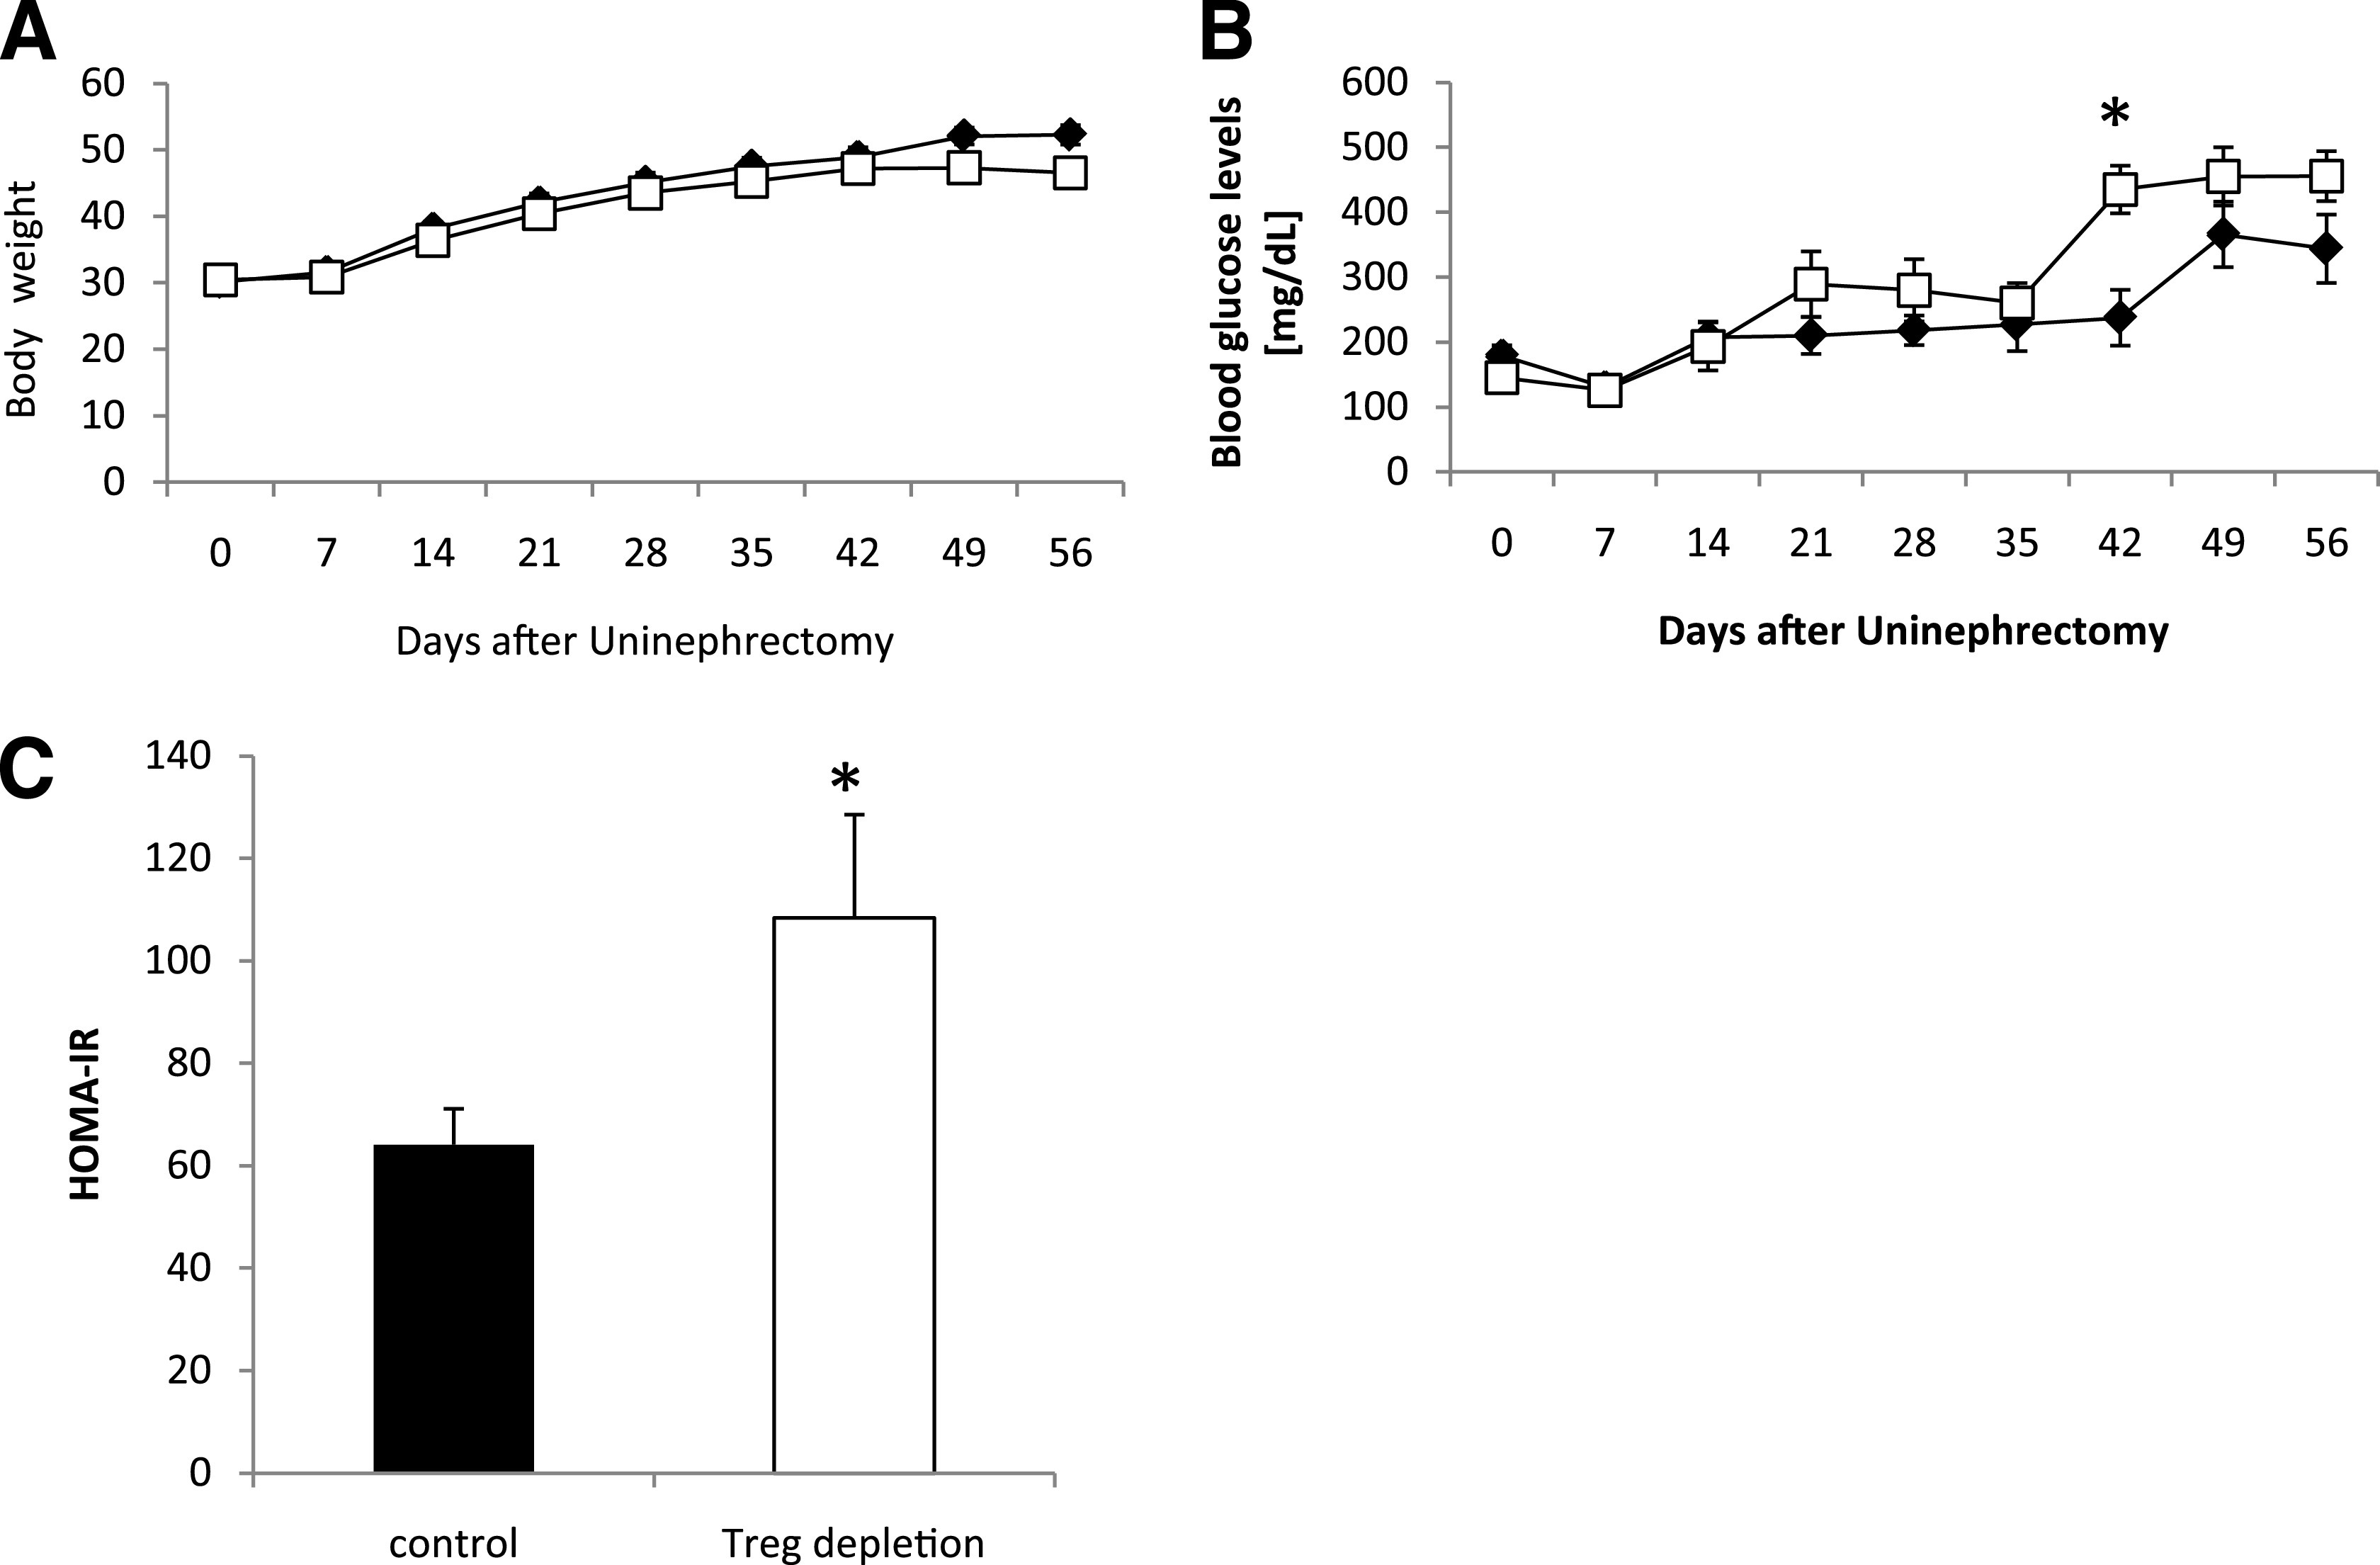
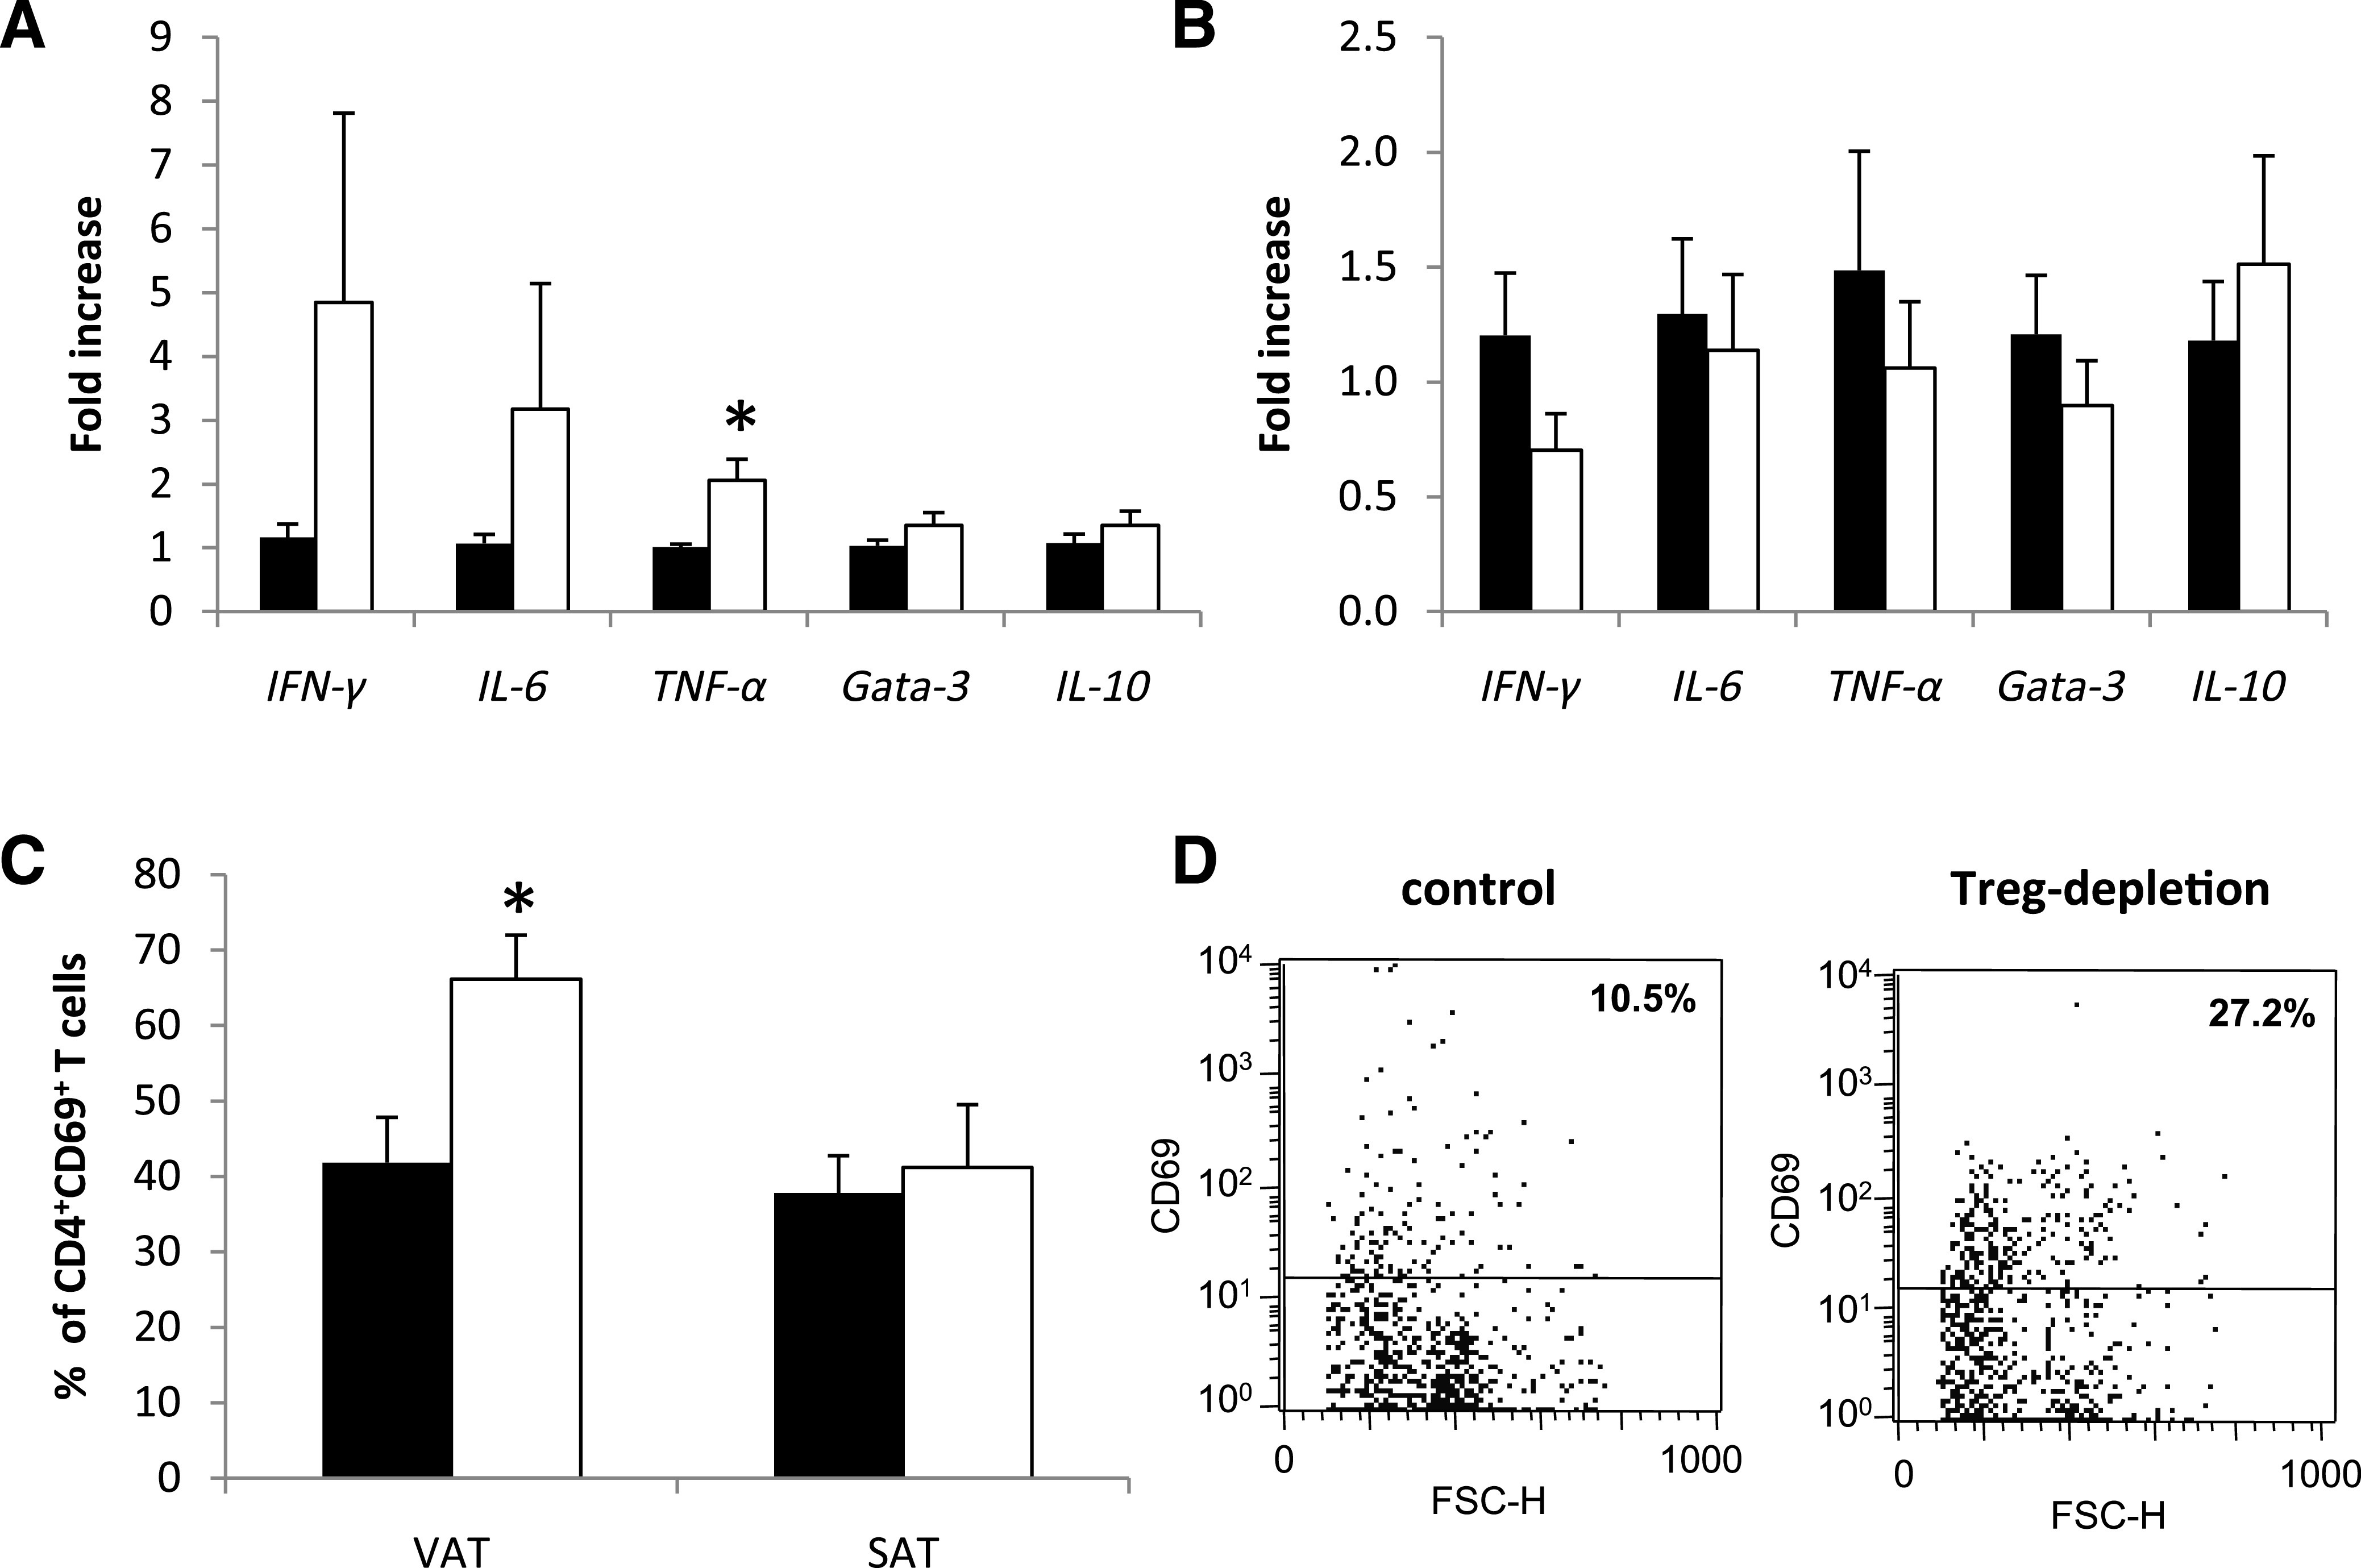
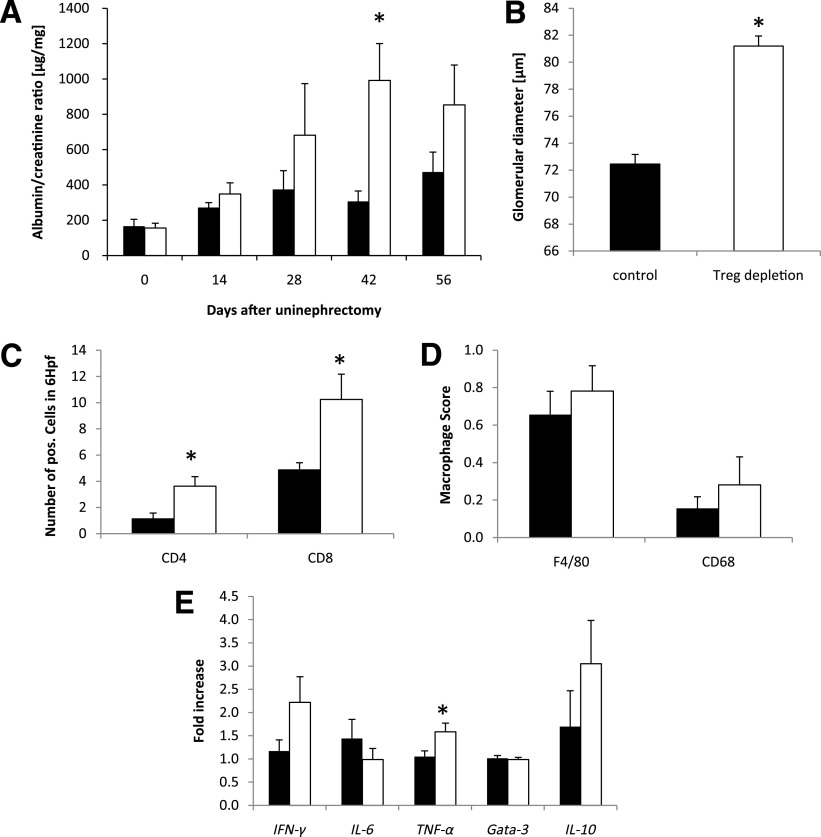
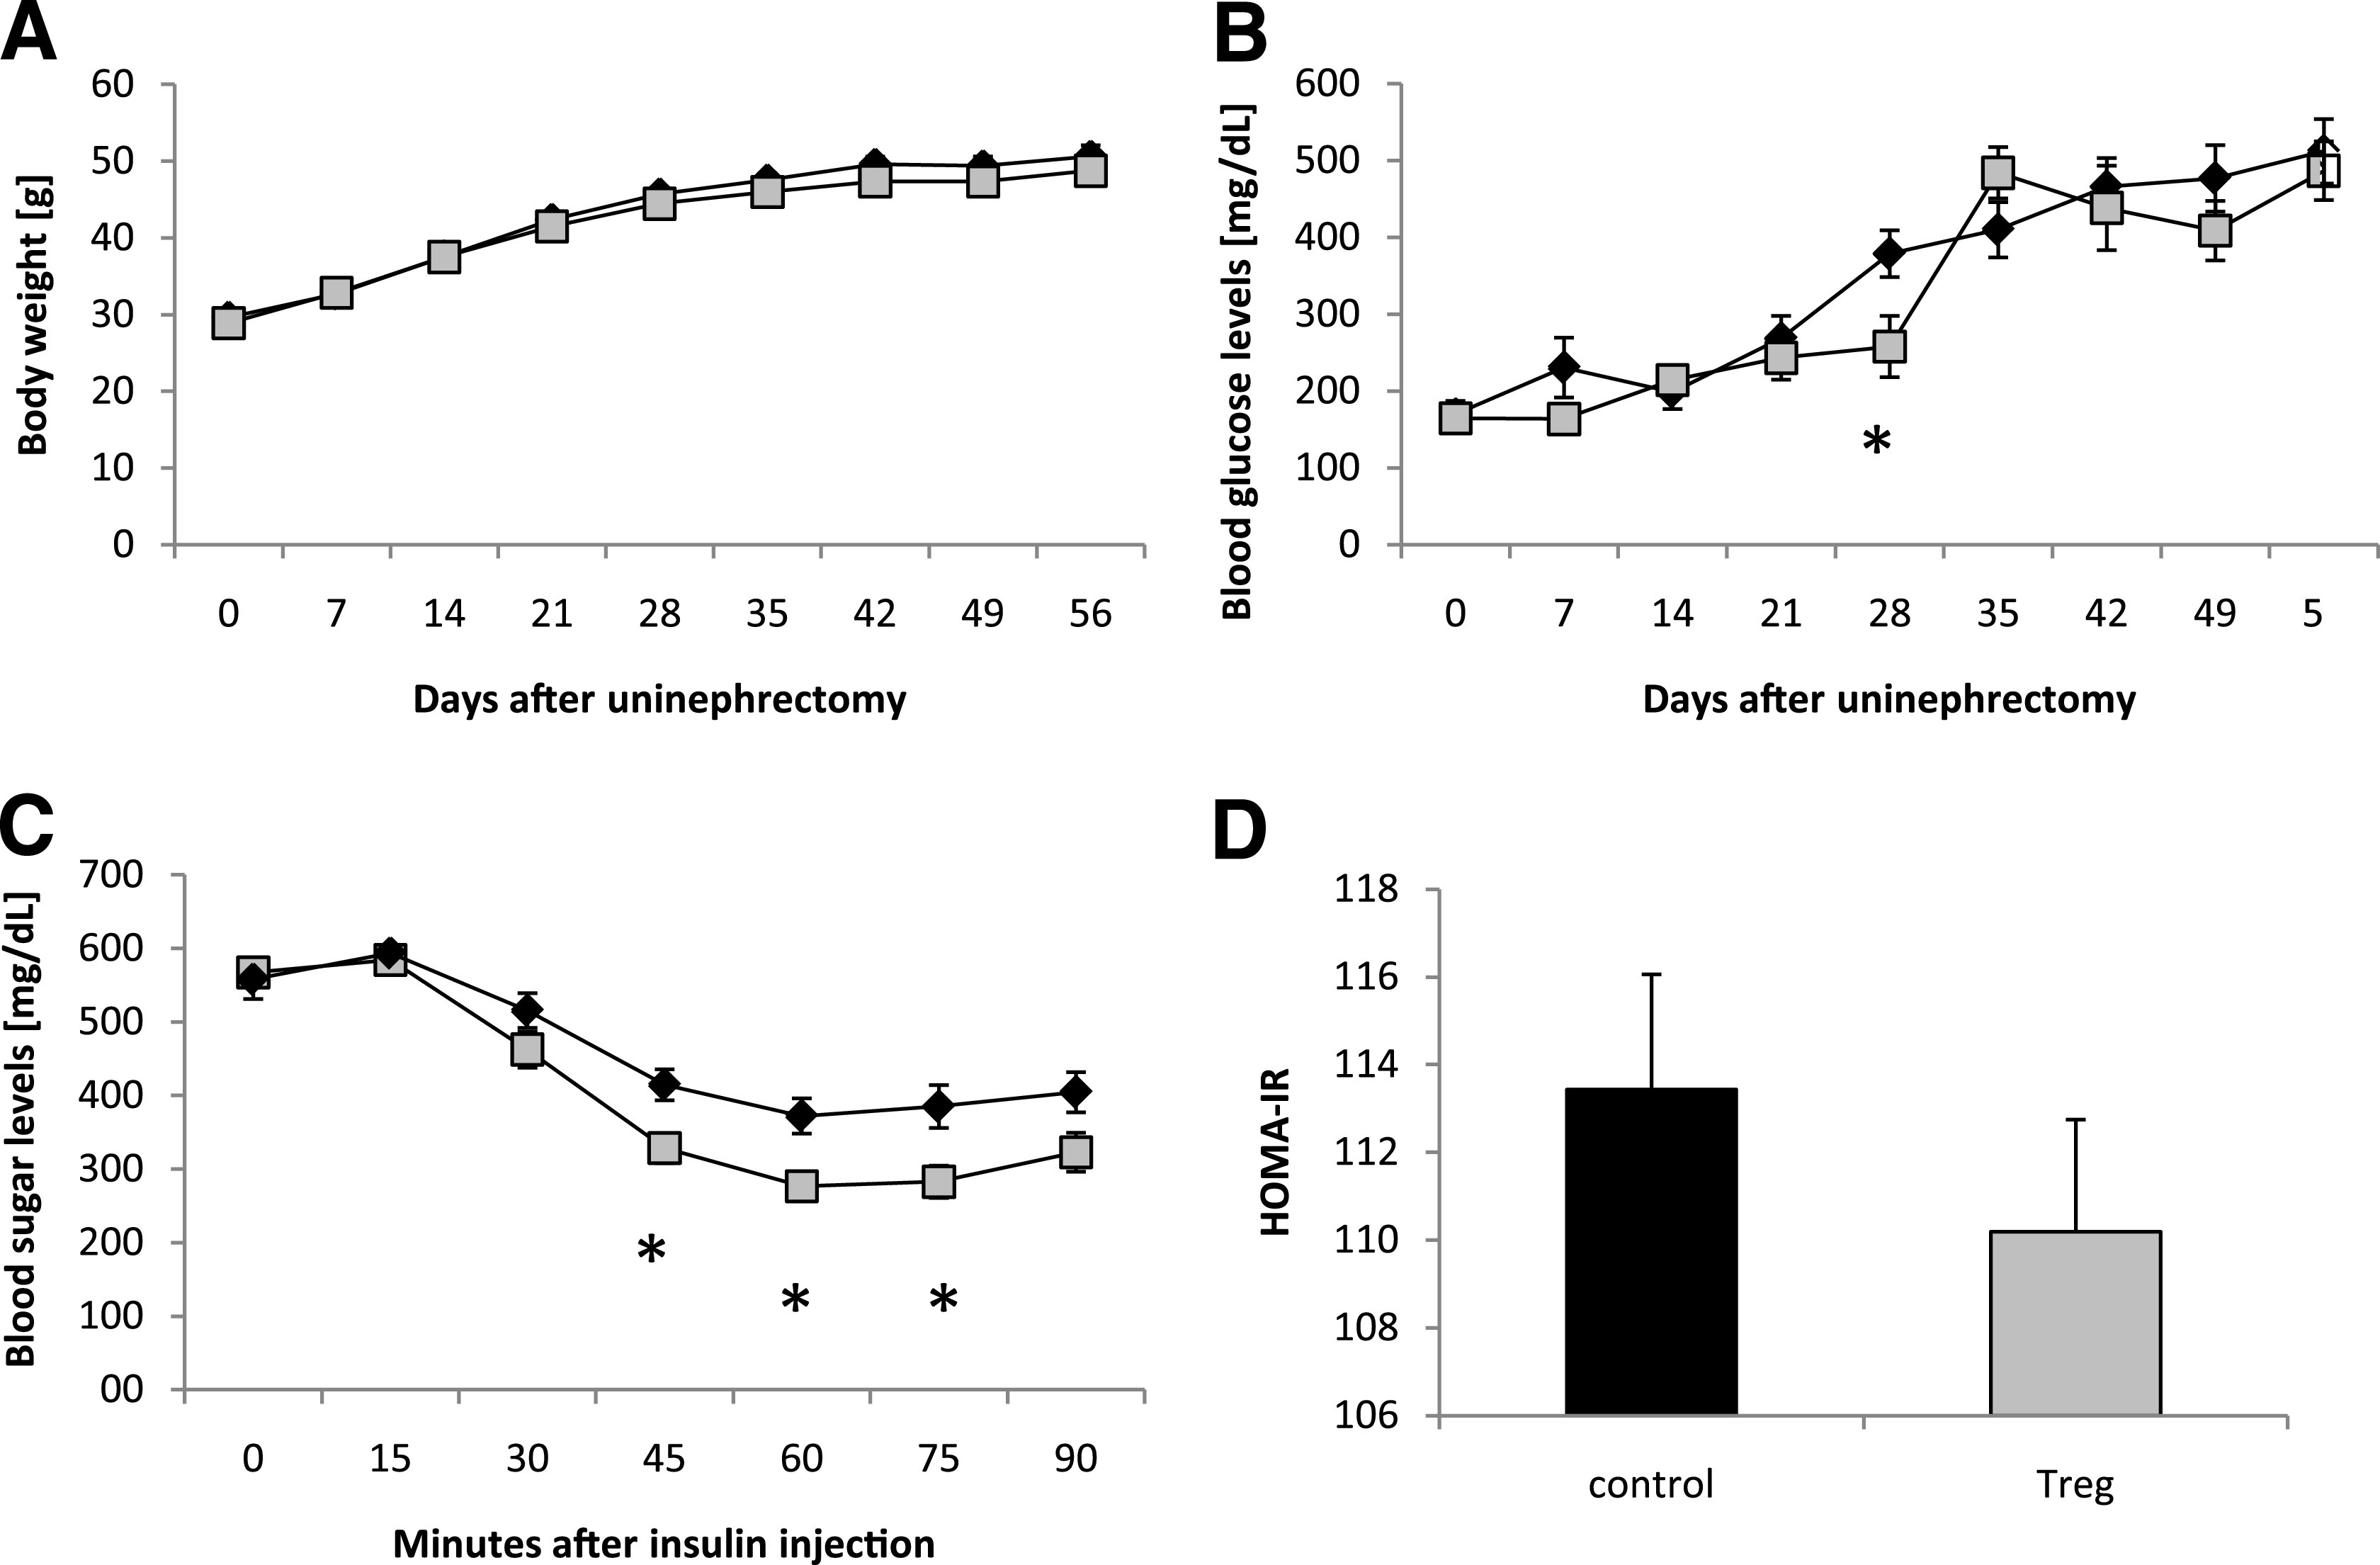
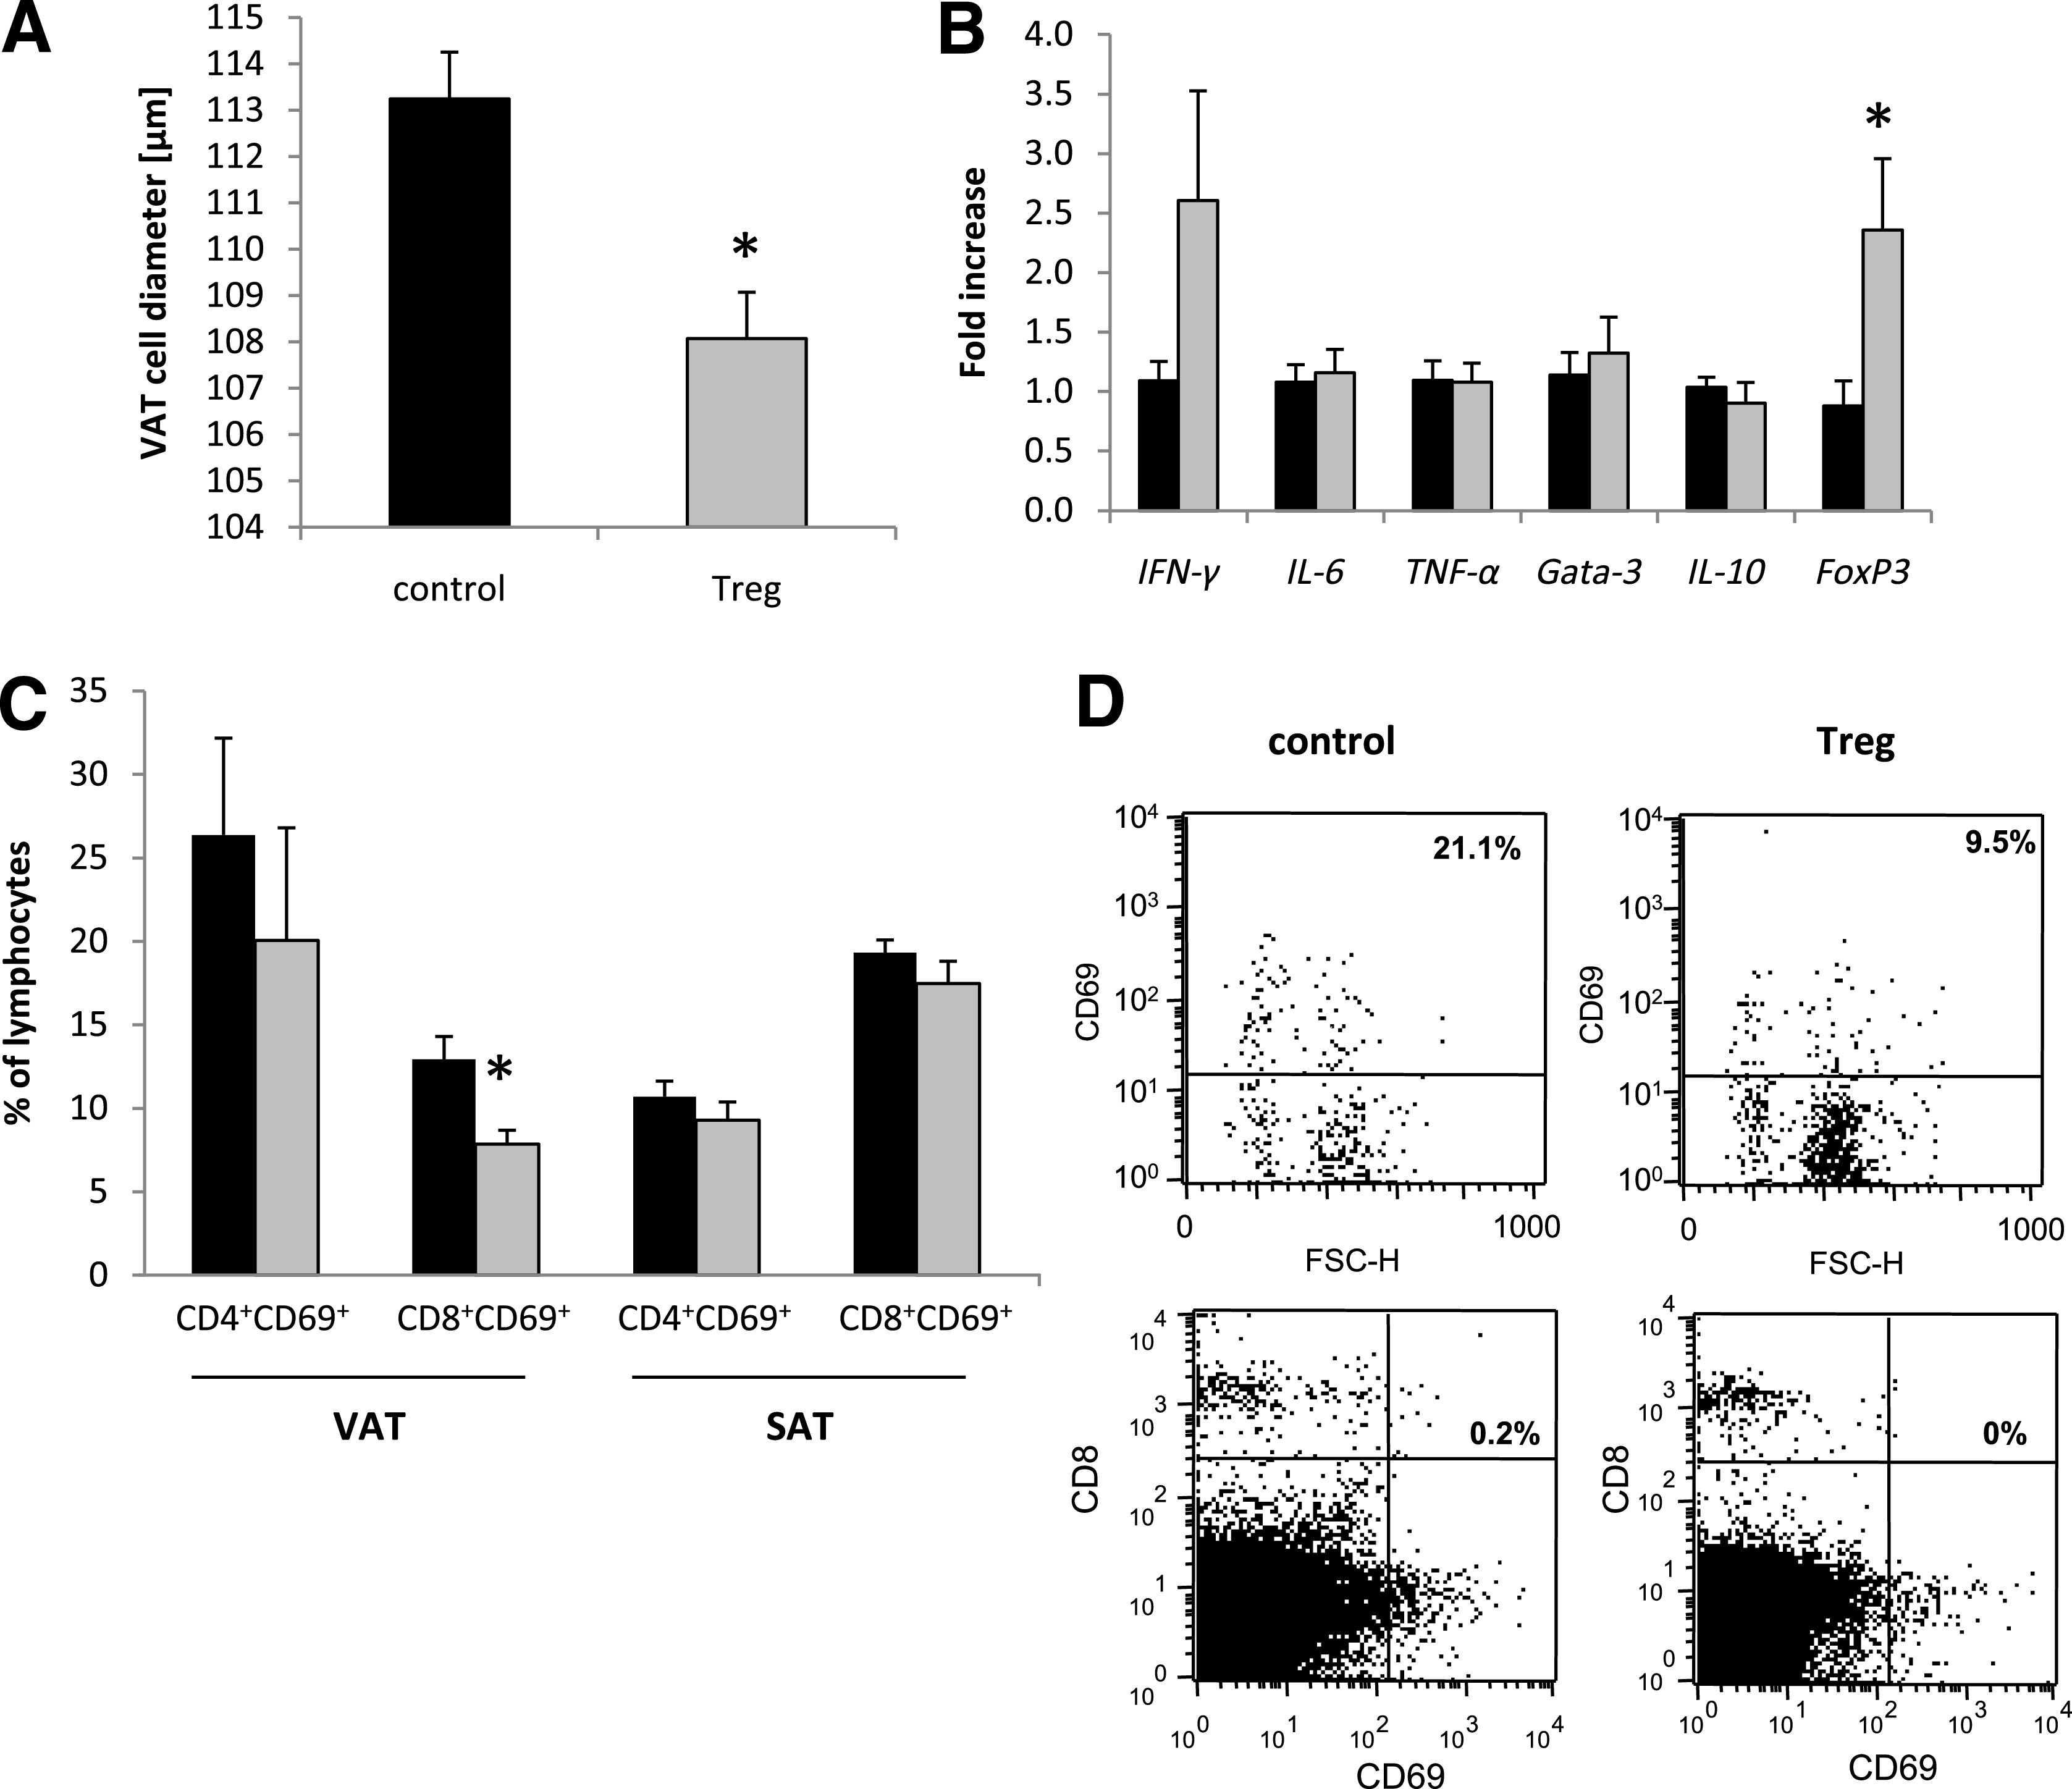
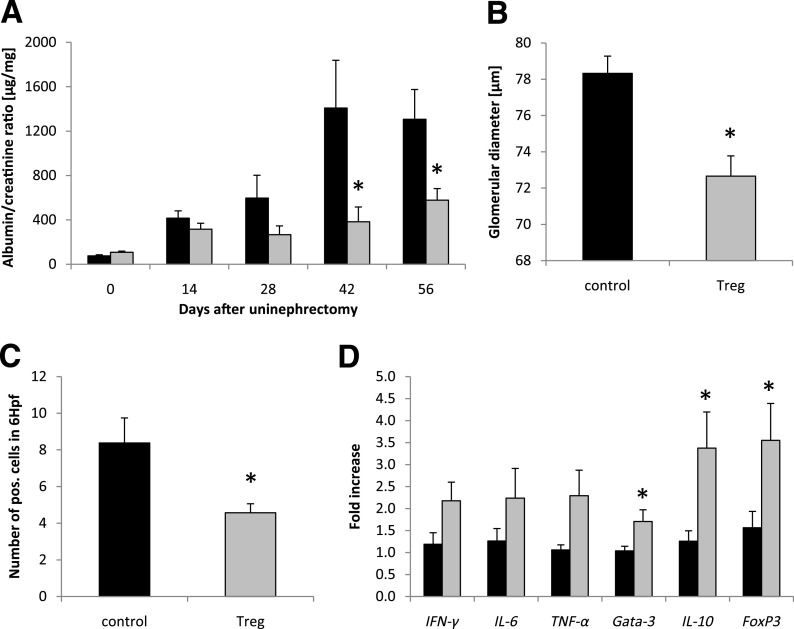
Results: Obese patients with insulin resistance displayed significantly decreased natural Tregs but an increase in adaptive Tregs in their visceral adipose tissue as compared with lean control subjects. To further evaluate the pathogenic role of Tregs in insulin resistance, the db/db mouse model was used. Treg depletion using an anti-CD25 monoclonal antibody enhanced insulin resistance as shown by increased fasting blood glucose levels as well as an impaired insulin sensitivity. Moreover, Treg-depleted db/db mice developed increased signs of diabetic nephropathy, such as albuminuria and glomerular hyperfiltration. This was paralleled by a proinflammatory milieu in both murine visceral adipose tissue and the kidney. Conversely, adoptive transfer of CD4(+)FoxP3(+) Tregs significantly improved insulin sensitivity and diabetic nephropathy. Accordingly, there was increased mRNA expression of FoxP3 as well as less abundant proinflammatory CD8(+)CD69(+) T cells in visceral adipose tissue and kidneys of Treg-treated animals.

Conclusions: Data suggest a potential therapeutic value of Tregs to improve insulin resistance and end organ damage in type 2 diabetes by limiting the proinflammatory milieu.


Figures

FIG. 1.
FIG. 1.
Obese patients with insulin resistance display significantly decreased Helios but increased FOXP3 mRNA expression in their hVAT. A: hVAT of lean control subjects (white bar, n = 14), obese patients with normal insulin sensitivity (HOMA <2.5, gray bar, n = 39), and obese patients with impaired insulin sensitivity (HOMA >5, black bar, n = 39) was analyzed for Helios and FOXP3 mRNA expression. P < 0.025 was considered significant; n.s., not significant. Correlation of the Helios-to-FOXP3 mRNA ratio in hVAT (n = 92) with BMI (P = 0.121) (B), HOMA-IR (P = 0.003) (C), and fasting blood glucose levels (P = 0.045) (D) was analyzed using Spearman ρ. P < 0.05 was considered significant.
FIG. 2.
FIG. 2.
Treg-depletion aggravates insulin resistance. Db/db mice were uninephrectomized at the age of 6 weeks and followed for 56 days. One group intraperitoneally received an anti-CD25 antibody starting the day of and 4 weeks after uninephrectomy (□ and white bar, n = 8). Control animals received an isotype control antibody (♦ and black bar, n = 8). Body weight (A) and blood glucose levels (B) were measured weekly. C: On day 56, the HOMA-IR index was calculated. Pooled data of two independent experiments are shown. *P < 0.05.
FIG. 3.
FIG. 3.
Treg depletion induces increased inflammation in visceral adipose tissue. Db/db mice were uninephrectomized at the age of 6 weeks and followed for 56 days. One group intraperitoneally received an anti-CD25 mAb the day of and 4 weeks after uninephrectomy (white bar, n = 8); the control group received an isotype control antibody (black bar, n = 8). The cytokine response in VAT (A) and SAT (B) was evaluated by real-time PCR. The fold increase to the mean expression of controls is provided. C: The percentage of CD4+CD69+ T cells was evaluated in VAT and SAT by flow cytometry. Pooled data of two independent experiments are shown. *P < 0.05. D: Representative dot plots from gated CD4+ T cells in VAT. FSC-H, forward scatter height.
FIG. 4.
FIG. 4.
Treg depletion fosters organ damage in diabetic nephropathy. Db/db mice were uninephrectomized at the age of 6 weeks and followed for 56 days. One group intraperitoneally received an anti-CD25 antibody on the day of and 4 weeks after uninephrectomy (white bar, n = 8). Control animals received an isotype control antibody (black bar, n = 8). A: The albumin-to-creatinine ratio was evaluated in the urine every 14 days. B: After 56 days, kidneys were harvested and the glomerular diameter was measured. Kidney sections were stained for the infiltration of CD4+ and CD8+ T cells (C) as well as F4/80+ cells and CD68+ macrophages (D). Hpf, high-power field. E: The cytokine response in the kidney was evaluated by real-time PCR. The fold increase to the mean expression of control animals is provided. Pooled data of two independent experiments are shown. *P < 0.05.
FIG. 5.
FIG. 5.
Adoptive Treg transfer restores insulin sensitivity in type 2 diabetes. Db/db mice were uninephrectomized at the age of 6 weeks and followed for 56 days. One group intravenously received FACS-sorted CD4+FoxP3+ Tregs every 14 days (gray cubes and bar, n = 8). Control animals received CD4+FoxP3 cells (black diamonds and bar, n = 8). Body weight (A) and blood glucose levels (B) were measured weekly. On day 56, the insulin-sensitivity testing was performed (C) and the HOMA-IR index was calculated (D). Pooled data of two independent experiments are shown. *P < 0.05.
FIG. 6.
FIG. 6.
Treg treatment induces a shift toward an anti-inflammatory milieu in VAT. Db/db mice were uninephrectomized at the age of 6 weeks and followed for 56 days. One group intravenously received FACS-sorted CD4+FoxP3+ Tregs every 14 days (gray bar), whereas the control group was injected with CD4+FoxP3 control T cells (black bar). A: The VAT cell diameter was determined by morphological evaluation (n = 4 per group). B: The cytokine response in VAT was quantified by real-time PCR (n = 8 per group). The fold increase to the mean expression of controls is provided. C: The percentage of CD4+CD69+ and CD8+CD69+ T cells was evaluated in VAT and SAT by flow cytometry (n = 4 per group). Pooled or representative data of two independent experiments are shown. *P < 0.05. D: Representative dot plots from gated CD8+ T cells and from CD8/CD69 double staining in VAT. FSC-H, forward scatter height.
FIG. 7.
FIG. 7.
Treg treatment improves diabetic nephropathy. Db/db mice were uninephrectomized at the age of 6 weeks and followed for 56 days. One group intravenously received FACS-sorted CD4+FoxP3+ Tregs every 14 days (gray bar), whereas control animals received CD4+FoxP3 T cells (black bar). A: The albumin-to-creatinine ratio was evaluated in the urine every 14 days. B and C: After 56 days, kidneys were harvested and the glomerular diameter was morphologically determined (n = 4 per group) (B), and kidney sections were stained for the infiltration of CD8+ T cells (n = 8 per group) (C). Hpf, high-power field. D: The cytokine response in the kidney was evaluated by real-time PCR (n = 8 per group). The fold increase to the mean expression of controls is provided. Pooled data of two independent experiments are shown. *P < 0.05.

References

    1. Siegmund K, Feuerer M, Siewert C, et al. . Migration matters: regulatory T-cell compartmentalization determines suppressive activity in vivo. Blood 2005;106:3097–3104 - PMC - PubMed
    1. Wolf D, Hochegger K, Wolf AM, et al. . CD4+CD25+ regulatory T cells inhibit experimental anti-glomerular basement membrane glomerulonephritis in mice. J Am Soc Nephrol 2005;16:1360–1370 - PubMed
    1. Read S, Malmström V, Powrie F. Cytotoxic T lymphocyte-associated antigen 4 plays an essential role in the function of CD25(+)CD4(+) regulatory cells that control intestinal inflammation. J Exp Med 2000;192:295–302 - PMC - PubMed
    1. Mottet C, Uhlig HH, Powrie F. Cutting edge: cure of colitis by CD4+CD25+ regulatory T cells. J Immunol 2003;170:3939–3943 - PubMed
    1. Viglietta V, Baecher-Allan C, Weiner HL, Hafler DA. Loss of functional suppression by CD4+CD25+ regulatory T cells in patients with multiple sclerosis. J Exp Med 2004;199:971–979 - PMC - PubMed

Publication types

MeSH terms