Effects of genetic susceptibility for type 2 diabetes on the evolution of glucose homeostasis traits before and after diabetes diagnosis: data from the D.E.S.I.R. Study
- PMID: 21911746
- PMCID: PMC3178301
- DOI: 10.2337/db10-1442
Effects of genetic susceptibility for type 2 diabetes on the evolution of glucose homeostasis traits before and after diabetes diagnosis: data from the D.E.S.I.R. Study
Abstract
Objective: To assess the impact of genetic susceptibility on evolution toward type 2 diabetes (T2D) by analyzing time trajectories of fasting glucose, glycated hemoglobin (HbA(1c)), insulin sensitivity (homeostasis model assessment [HOMA2%S]), and β-cell secretion (HOMA2%B) in a large nondiabetic cohort. We also examined whether baseline HbA(1c) modified the effect of genetic predisposition on the time trajectories.
Research design and methods: Time trajectories were drawn in 4,744 participants from the French Data from an Epidemiological Study on the Insulin Resistance Syndrome (D.E.S.I.R.) cohort based on samples collected every 3 years over a 9-year follow-up. Trajectories were analyzed according to the TCF7L2 common variant, a family history of T2D, and a combination of at-risk alleles from nine T2D-associated genes.
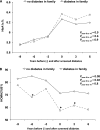
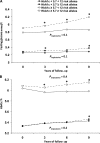
Results: There was a marked decrease in HOMA2%B in parallel to a steep increase in HbA(1c) over the 3 years before incident diabetes, which was not influenced by genetic predisposition when considered alone. However, after the onset of T2D, the TCF7L2 at-risk variant was associated with a greater decrease in HOMA2%B. There was a joint effect of a family history of T2D with the presence of the TCF7L2 risk allele with a greater rise in HbA(1c) conferred by the coexistence of a family history and the T risk allele. An HbA(1c) ≥5.7% at baseline was associated with a greater increase in both glycemia and HbA(1c) levels in the presence of a combination of diabetes at-risk alleles.
Conclusions: After incident T2D, TCF7L2 at-risk variants were associated with a faster decrease in β-cell function compared with those with the CC genotype. There was a joint effect of family history of T2D and TCF7L2 risk variant on the rise in glycemia and the decrease in insulin secretion at the end of follow-up, suggesting the joint influence of the combination of diabetes genetic predisposition with familial factors on the evolution of glycemia over time.
Figures


References
-
- Festa A, Williams K, D’Agostino R, Jr, Wagenknecht LE, Haffner SM. The natural course of beta-cell function in nondiabetic and diabetic individuals: the Insulin Resistance Atherosclerosis Study. Diabetes 2006;55:1114–1120 - PubMed
-
- Festa A, Williams K, Hanley AJ, Haffner SM. Beta-cell dysfunction in subjects with impaired glucose tolerance and early type 2 diabetes: comparison of surrogate markers with first-phase insulin secretion from an intravenous glucose tolerance test. Diabetes 2008;57:1638–1644 - PubMed
-
- Ferrannini E, Nannipieri M, Williams K, Gonzales C, Haffner SM, Stern MP. Mode of onset of type 2 diabetes from normal or impaired glucose tolerance. Diabetes 2004;53:160–165 - PubMed
-
- Guerrero-Romero F, Rodríguez-Morán M. Assessing progression to impaired glucose tolerance and type 2 diabetes mellitus. Eur J Clin Invest 2006;36:796–802 - PubMed
Publication types
MeSH terms
Substances
LinkOut - more resources
Full Text Sources
Medical
Miscellaneous

