. 2011 Oct;53(10):1146-54.
doi: 10.1097/JOM.0b013e31822b8356.

Fitness for duty: a 3-minute version of the Psychomotor Vigilance Test predicts fatigue-related declines in luggage-screening performance

Affiliations

Fitness for duty: a 3-minute version of the Psychomotor Vigilance Test predicts fatigue-related declines in luggage-screening performance

Mathias Basner et al. J Occup Environ Med. 2011 Oct.

Abstract

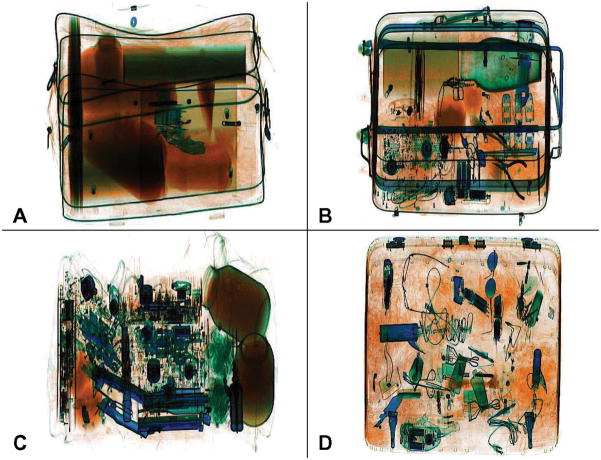
Objective: To evaluate the ability of a 3-minute Psychomotor Vigilance Test (PVT) to predict fatigue-related performance decrements on a simulated luggage-screening task (SLST).

Methods: Thirty-six healthy nonprofessional subjects (mean age = 30.8 years, 20 women) participated in a 4-day laboratory protocol including a 34-hour period of total sleep deprivation with PVT and SLST testing every 2 hours.

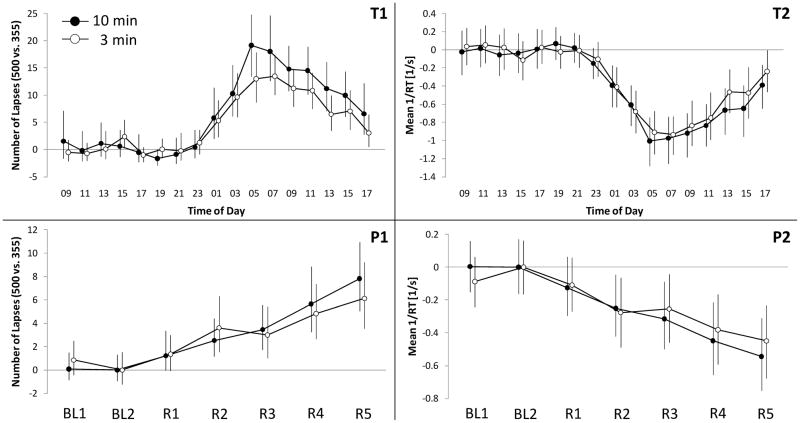
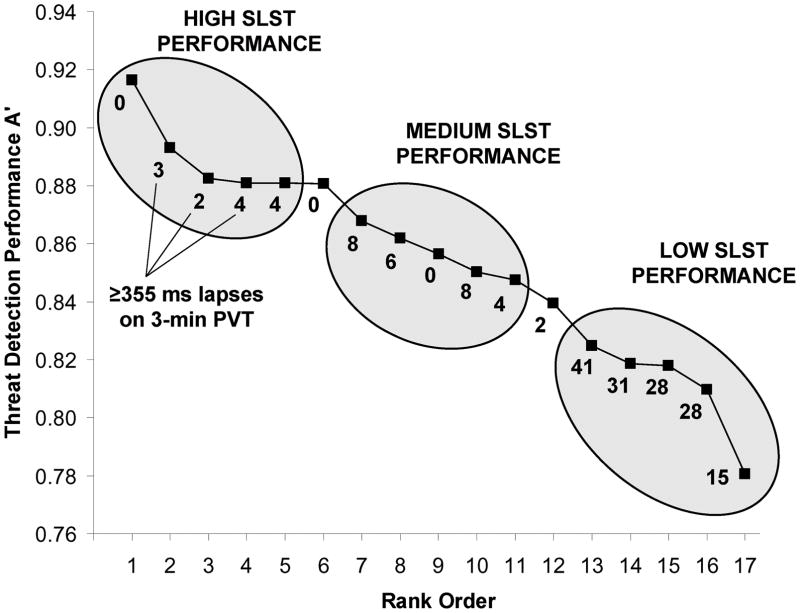
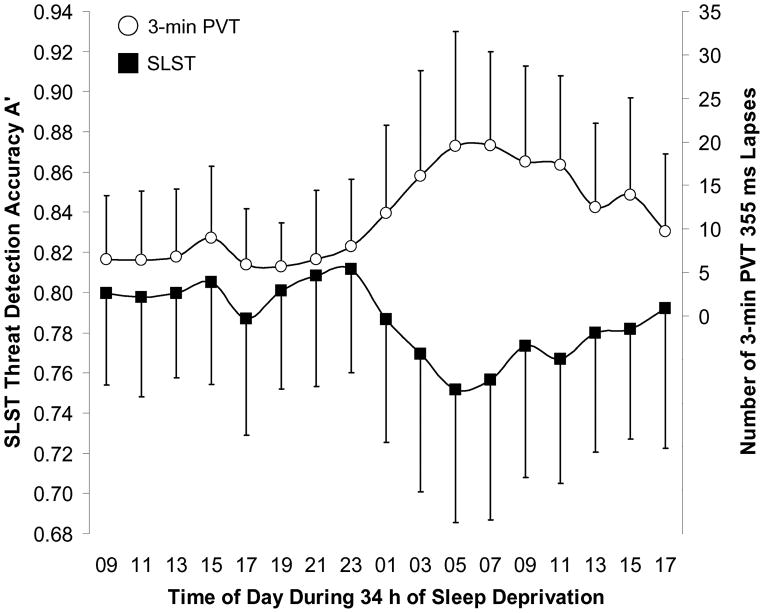
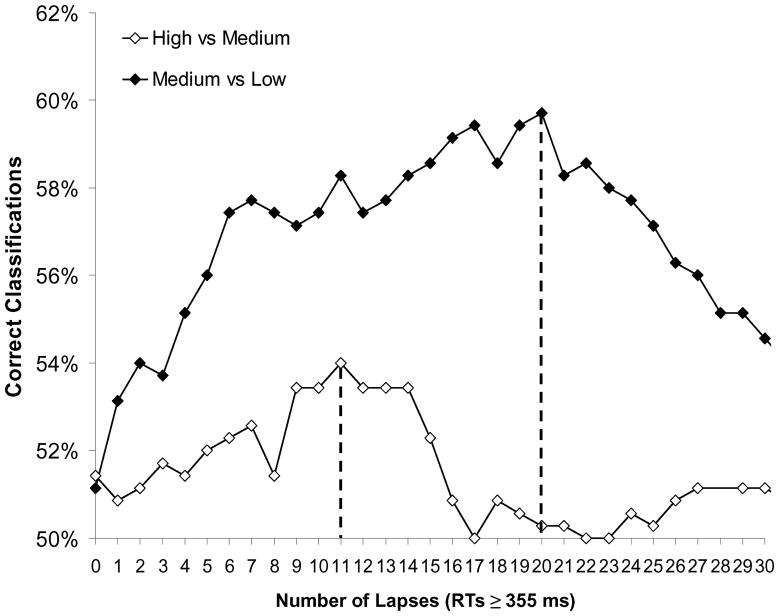
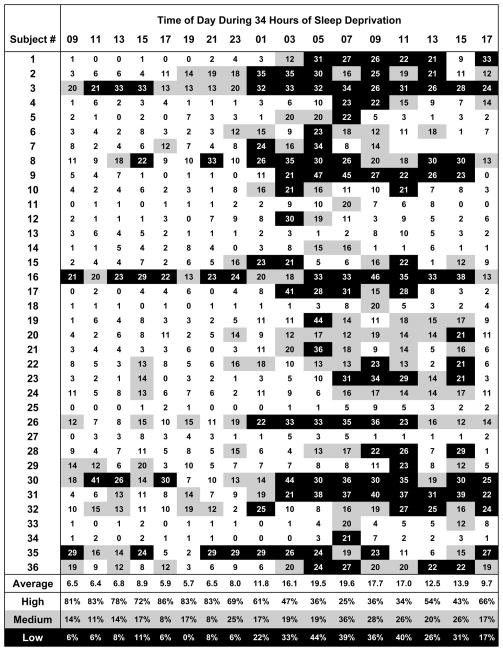
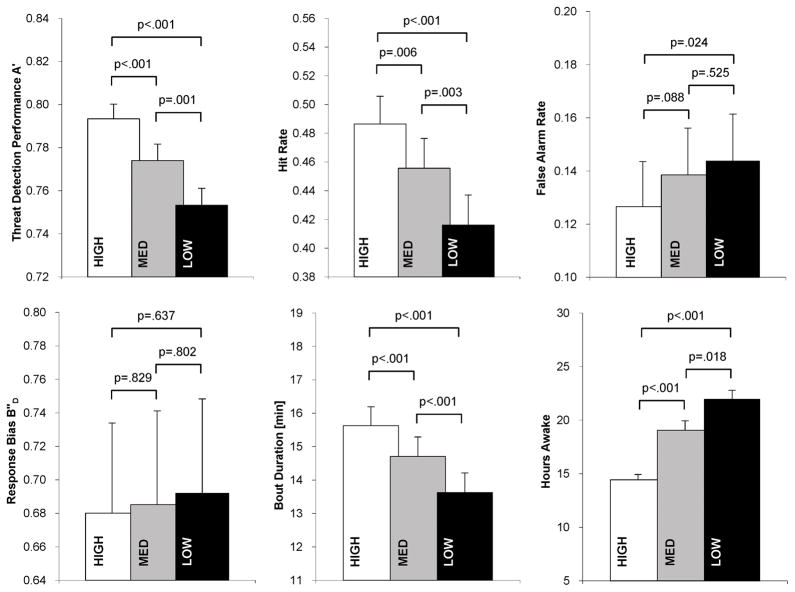
Results: Eleven and 20 lapses (355-ms threshold) on the PVT optimally divided SLST performance into high-, medium-, and low-performance bouts with significantly decreasing threat detection performance A'. Assignment to the different SLST performance groups replicated homeostatic and circadian patterns during total sleep deprivation.

Conclusions: The 3-minute PVT was able to predict performance on a simulated luggage-screening task. Fitness-for-duty feasibility should now be tested in professional screeners and operational environments.


Figures

Figure 1
Figure 1
Coherence of the 3-min (open circles) and the standard 10-min PVT (black circles) is shown for total (graphs T1 and T2, N=31 subjects staying awake for 34 h) and partial sleep deprivation (graphs P1 and P2, N=43 subjects restricted to 4 h TIB for 5 consecutive nights during R1 to R5 after 2 baseline nights BL1 and BL2 with 10 h TIB) for the outcome metrics mean reciprocal response time (mean 1/RT) and lapses (lapse thresholds 500 ms for the 10 min PVT and 355 ms for the 3 min PVT). Results were centered around daytime performance (bouts 1 to 7 for T1 and T2) and baseline performance on day 2 (BL2 for P1 and P2), respectively. Error bars represent bias-corrected and accelerated (BCa) 95% confidence intervals based on a bootstrap sample with 1,000,000 replications (29). Paired t-tests (two-sided and adjusted for multiple testing with the false discovery rate method (30)) indicated that there were no statistically significant differences between the 3 min and the 10 min PVT for bouts 8 to 17 (T1 and T2) and R1 to R5 (P1 and P2) at alpha 0.05.
Figure 2
Figure 2
Examples of simulated X-ray images of threat bags with typical hit rates (HR). A: gun with low target difficulty in the center (HR was 75%), B: knife with low target difficulty in upper right corner (HR was 56.5%), C: gun with high target difficulty in lower right corner (HR was 50%), D: knife with high target difficulty in lower left corner (HR was 32.5%). Reproduced from Basner M, Rubinstein J, Fomberstein KM, et al. Effects of Night Work, Sleep Loss and Time on Task on Simulated Threat Detection Performance. SLEEP 2008;31(9):1251–1259 (with permission)
Figure 3
Figure 3
Visualization of the method for determination optimal lapse thresholds. Bouts were rank ordered within subjects from highest to lowest threat detection performance A′, and then categorized into high (ordered bouts 1–5), medium (ordered bouts 7–11), and low (ordered bouts (–17) performance bouts (data of one subject are shown by way of example). Each SLST bout was associated with a certain ≥355 ms lapse frequency on the 3-min PVT (number of lapses shown below each square representing an SLST bout). Data of all subjects were then pooled and lapse frequencies with the highest percentage of correct classifications according to SLST performance group were determined.
Figure 4
Figure 4
Co-variation of mean (including standard deviation) SLST threat detection accuracy A′ (black squares, left ordinate) and average number of ≥355 ms lapses on the 3-min PVT (white circles, right ordinate) during a 34-h period of total sleep deprivation.
Figure 5
Figure 5
The number of correct classifications between high and medium (white diamonds) and medium and low (black diamonds) SLST performance bouts based on the number of ≥355 ms lapses on the 3-min PVT is shown. The two optimal decision thresholds divide SLST performance into high (≤11 lapses), medium (12–20 lapses), and low (>20 lapses) groups.
Figure 6
Figure 6
The number of ≥355 ms lapses on the 3-min PVT is shown for all 36 subjects and all 17 bouts during 34-h of total sleep deprivation. Classification based on these lapses is indicated by white (high SLST performance group, ≤11 lapses), gray (medium SLST performance group, 12–20 lapses), and black (low SLST performance group, >21 lapses) backgrounds. The average number of ≥355 ms lapses and the size of the three performance categories is shown depending on time of day during total sleep deprivation at the bottom of the figure.
Figure 7
Figure 7
Expected means and standard errors of threat detection performance A′, hit rate, false alarm rate, response bias B″D, bout duration, and hours awake since wake-up time are compared between high, medium, and low SLST performance groups (group classification based on the number of ≥355 ms lapses on the 3-min PVT).

References

    1. Basner M, Rubinstein J, Fomberstein KM, et al. Effects of night work, sleep loss and time on task on simulated threat detection performance. Sleep. 2008;31:1251–1259. - PMC - PubMed
    1. Dinges DF, Mallis M. In: Managing fatigue by drowsiness detection: can technological promises be realized? Hartley L, editor. Pergamon; 1998. pp. 209–229.
    1. Gilliland K, Schlegel RE. Readiness to perform: A critical analysis of the concept and current practices. Office of Aviation Medicine, Federal Aviation Administration; 1993.
    1. Dinges DF, Powell JW. Microcomputer analysis of performance on a portable, simple visual RT task during sustained operations. BehavResMethods InstrumComput. 1985;6:652–655.
    1. Lim J, Dinges DF. Molecular and Biophysical Mechanisms of Arousal, Alertness, and Attention Annals of the New York Academy of Sciences. Oxford: Blackwell Publishing; 2008. Sleep deprivation and vigilant attention; pp. 305–322. - PubMed

Publication types