. 2011 Sep;7(9):e1002248.
doi: 10.1371/journal.pgen.1002248. Epub 2011 Sep 1.

Tsx produces a long noncoding RNA and has general functions in the germline, stem cells, and brain

Affiliations

Tsx produces a long noncoding RNA and has general functions in the germline, stem cells, and brain

Montserrat C Anguera et al. PLoS Genet. 2011 Sep.

Abstract

The Tsx gene resides at the X-inactivation center and is thought to encode a protein expressed in testis, but its function has remained mysterious. Given its proximity to noncoding genes that regulate X-inactivation, here we characterize Tsx and determine its function in mice. We find that Tsx is actually noncoding and the long transcript is expressed robustly in meiotic germ cells, embryonic stem cells, and brain. Targeted deletion of Tsx generates viable offspring and X-inactivation is only mildly affected in embryonic stem cells. However, mutant embryonic stem cells are severely growth-retarded, differentiate poorly, and show elevated cell death. Furthermore, male mice have smaller testes resulting from pachytene-specific apoptosis and a maternal-specific effect results in slightly smaller litters. Intriguingly, male mice lacking Tsx are less fearful and have measurably enhanced hippocampal short-term memory. Combined, our study indicates that Tsx performs general functions in multiple cell types and links the noncoding locus to stem and germ cell development, learning, and behavior in mammals.


Conflict of interest statement

The authors have declared that no competing interests exist.

Figures

Figure 1
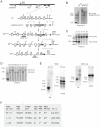
Figure 1. Tsx is a long noncoding RNA.
(A) Map of the X-inactivation center, with positions and transcriptional orientations of each gene. (B) ORFs from Tsx and Xist, similar in length and lacking stop codons, were cloned into expression vectors in frame with a V5 and His6 epitope tags under control of the human EF-1a promoter (PEF-1a). After programming in rabbit Reticulocyte lysate, the reactions were run on an SDS-page gel. The luciferase control was supplied by the in vitro transcription/translation kit. (C) Western blots of human 293T cells and mouse ES cells (J1) after transfection with constructs shown in (B). In vitro-translated reactions were run alongside on an SDS-PAGE and then detected using anti-V5 and ß-actin antibodies. ß-actin, loading control. (D) Western blot of 293T cells transfected with constructs shown were detected using anti-HA and ß-actin antibodies. K, Kozack sequence; HA, HA tag. (E) Live-cell imaging after 48 hours of transfection with constructs in (D). Images were taken at 10× magnification and exposure times of 11 msec. The experiment was performed twice with similar results. One corresponding Western blot is shown in (D).
Figure 2
Figure 2. Tsx expression patterns.
(A) Map of Tsx with locations of primer pairs used in PCR analysis. ATG start site is indicated by a green star. Quantitative RT-PCR analysis of Tsx RNA in adult female and male tissues (age matched littermates). Standard deviations refer to triplicate measures for each tissue sample from at least two different animals. Tsx primers B10 and B11 (spanning exons 1 through 7) were used for amplification. (B) Quantitative RT-PCR analysis of Tsx RNA during spermatogenesis. Type A Spermatogonia (AS), Type B Spermatogonia (BS), Pachytene Spermatocytes (PS), Round Spermatids (RS). The same primer set from (A) was used for amplification, and similar results were observed with primers Tsx 1 and Tsx 2 (also spanning exons 1 and 7). (C) Quantitative PCR analysis of Tsx RNA for nuclear and cytoplasmic fractions of pachytene spermatocytes and round spermatids. The same primer sets from (B) were used to amplify Tsx RNA (shown are results using Tsx B10 and Tsx B11). (D) Map indicating alternative splicing at the 5′ end of the transcripts cloned from PS. There is no evidence for alternative splicing between exons 2–7. Therefore, exons 5–7 are not shown for the splice variants. Tsx primers denoted by red arrows, and the ATG start site is indicated by a green star. Alternative transcripts were amplified using the same reverse primer (Tsx 3.5L; exon 4) and four different forward primers (RPL-b, RPL-a, RPL, RPS) located upstream of exon 1.
Figure 3
Figure 3. Generation of TsxKO mice.
(A) Exon-intron structure of the Tsx locus (orientation relative to Xist) and the targeting strategy. The targeting vector DNA is represented as the grey line and the endogenous DNA is shown as the black line. Restriction enzymes are designated as (M) for MscI, (B) for BstZ17I, (S) for SphI. FRT sites, denoted as filled grey circles, flank the PGK-Neomycin selection marker (neo), and loxP sites are denoted as black triangles. Probes used for Southern blotting analyses are denoted as black horizontal bars. (B) Southern blotting of genomic DNA from three positive clones digested with MscI and probed with Tsx probe 7. ‘Control’ corresponds to a sample containing DNA from both wildtype cells (wt) and correctly targeted mutant cells (mutant). Clone 3A8 was selected for blastocyst injection. (C) Southern blotting of genomic tail DNA from pups from mating mutant Tsx2loxNeo male and female mice with FLP-Recombinase expressing animals. DNA was digested with SphI and probed using Tsx probe L2. (D) Southern blotting of genomic tail DNA from mutant animals, generated by mating mutant Tsx2loxNeo animals with EIIA-Cre mice. DNA was digested with BstZ17I and probed using Tsx probe L2. (E) Northern blot analyses of male testes and lung tissues from wildtype and mutant littermates. The blots were first probed for Tsx then stripped and re-probed for ß-actin. (F) Matings of Tsx-null animals. P-values were calculated using one-tailed Student's t-test assuming equal variance.
Figure 4
Figure 4. TsxKO affects testes size and induces pachytene-specific apoptosis.
(A) Average testes and body masses from 8 wildtype and 7 Tsx−/Y littermate animals aged 6 months. P-values were calculated using a one-tailed Student's t-test assuming equal variance. NS (Not Significant). (B) TUNEL staining (green) of seminiferous tubule sections from wildtype and Tsx−/Y littermates aged 7d, 14d, 2 months, and 1 year. Testes were fixed, paraffin embedded, then sectioned. TUNEL-positive cells are shown in green and nuclei stained with DAPI (blue). Three sets of littermates were analyzed yielding similar results; images from one set of littermates are shown. (C) Quantification of the number of TUNEL-positive cells from seminiferous tubule sections. The ratio of TUNEL-positive cells/tubules was determined by counting the number of TUNEL-positive cells within tubules for each field and dividing by the number of tubules per field. The number of tubules (n) counted for each sample is shown. P-values were calculated using Student's t-test. (D) Co-staining for TUNEL (green) and SCP-1 (red) in seminiferous tubule sections from Tsx KO animals aged 14d and 2 months. White stars indicate SCP-1 positive PS, and white arrows denote SCP-1 positive cells. Images were taken at 20×. (E) Co-staining for TUNEL (green) and Stra-8 (red) in tubule sections from Tsx−/Y animals during first wave of meiosis (males aged 14d). White stars indicate Stra-8 positive pre-meiotic cells, and arrows denote TUNEL positive cells that are also Stra-8 negative (meiotic germ cells). Images were taken at 20×.
Figure 5
Figure 5. Tsx KO ES cells exhibit differentiation defects and cell death.
(A) Quantitative RT-PCR analysis of Tsx RNA in male (J1) and female (EL16.7) mouse ES cells during differentiation. Mouse embryonic fibroblasts (MEFs). (B) Phase contrast images (all taken at 4×) of male and female Tsx-null undifferentiated ES cells (d0) and EBs at differentiation d4 and d6. ES cells were differentiated by suspension culture using medium lacking LIF in three independent experiments yielding similar results (images from one experiment are shown). (C) Cell growth of undifferentiated and differentiating male and female null ES cell lines. Equal numbers of cells were plated in triplicate on equal numbers of MEFs, then harvested daily and counted using an automated cell counter.
Figure 6
Figure 6. Analysis of Xist, Tsix, and Xite expression in TsxKO ES cells.
(A) RNA/DNA FISH analysis for Xist expression in female and male cells during early differentiation. First, an Xist probe was used to detect Xist RNA (red) followed by DNA FISH using a Smcx BAC probe (green) to denote the X-chromosome. Arrows denote the presence of Xist clouds and the arrowhead denotes the X-chromosome DNA signal from Smcx. All nuclei counted had either 2 green Smcx pinpoints (females) or 1 green pinpoint (males), indicating a diploid nucleus. (B) qRT-PCR analyses of Tsix, and Xite expression in undifferentiated and differentiating female and male TsxKO ES cells. P-values were calculated using one-tailed Student's t-test assuming unequal variance.
Figure 7
Figure 7. Tsx deletion affects behavior and short-term hippocampal-dependent memory consolidation in male mice.
(A) Open field test for the total distance traveled for wildtype (n = 9) and Tsx −/Y (n = 9) animals. (B) Open field test for ambulatory counts for the same group of male animals. (C) Open field test quantifying the amount of time spent in the center (Zone 1) of the chamber. * indicates P<0.05 for one-way ANOVA tests. (D) Conditioning response curve for fear conditioning tests for wildtype (n = 5) and Tsx −/Y (n = 7). (E) Contextual fear conditioning tests for 1 h and 24 h after training. The mean percentage of time spent freezing for two independent experiments is shown, for both wildtype (n = 10) and Tsx −/Y (n = 12) male animals. (F) Cued fear conditioning tests. The same groups of animals were tested in novel environmental chambers 48 hr after training (for two independent experiments). The mean percentage of time spent freezing is shown for animals before tone presentation (“pre-CS”) and during the phasic presentation of the tone (“CS”).

References

    1. Wutz A, Gribnau J. X inactivation Xplained. Curr Opin Genet Dev. 2007;17:387–393. - PubMed
    1. Lucchesi JC, Kelly WG, Panning B. Chromatin remodeling in dosage compensation. Annu Rev Genet. 2005;39:615–651. - PubMed
    1. Payer B, Lee JT. X chromosome dosage compensation: how mammals keep the balance. Annu Rev Genet. 2008;42:733–772. - PubMed
    1. Ahn JY, Lee JT. Retinoic acid accelerates downregulation of the Xist repressor, Oct4, and increases the likelihood of Xist activation when Tsix is deficient. BMC Dev Biol. 2010;10:90. - PMC - PubMed
    1. Jonkers I, Barakat TS, Achame EM, Monkhorst K, Kenter A, et al. RNF12 is an X-Encoded dose-dependent activator of X chromosome inactivation. Cell. 2009;139:999–1011. - PubMed

Publication types