. 2011;6(9):e23741.
doi: 10.1371/journal.pone.0023741. Epub 2011 Sep 1.

Thymoquinone inhibits the CXCL12-induced chemotaxis of multiple myeloma cells and increases their susceptibility to Fas-mediated apoptosis

Affiliations

Thymoquinone inhibits the CXCL12-induced chemotaxis of multiple myeloma cells and increases their susceptibility to Fas-mediated apoptosis

Gamal Badr et al. PLoS One. 2011.

Abstract

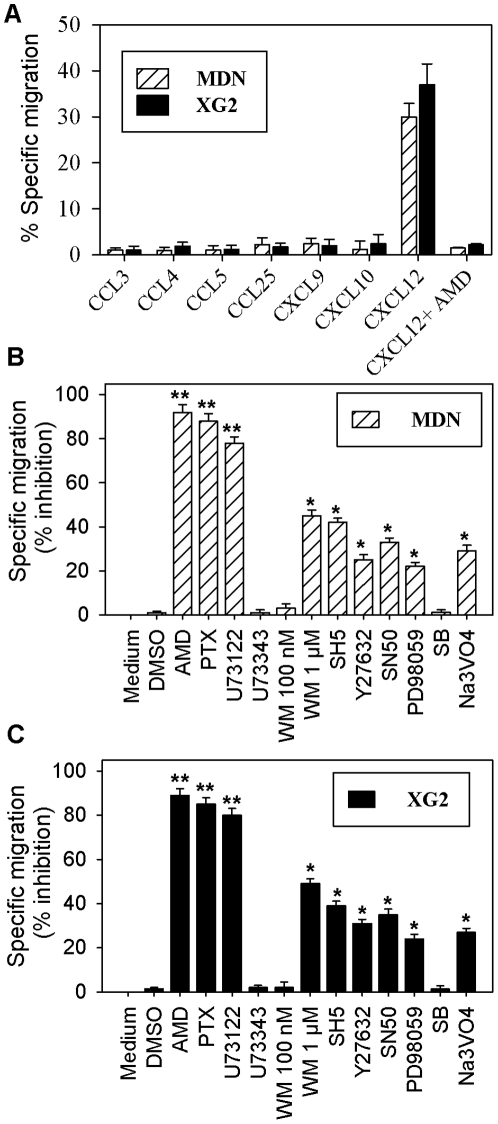
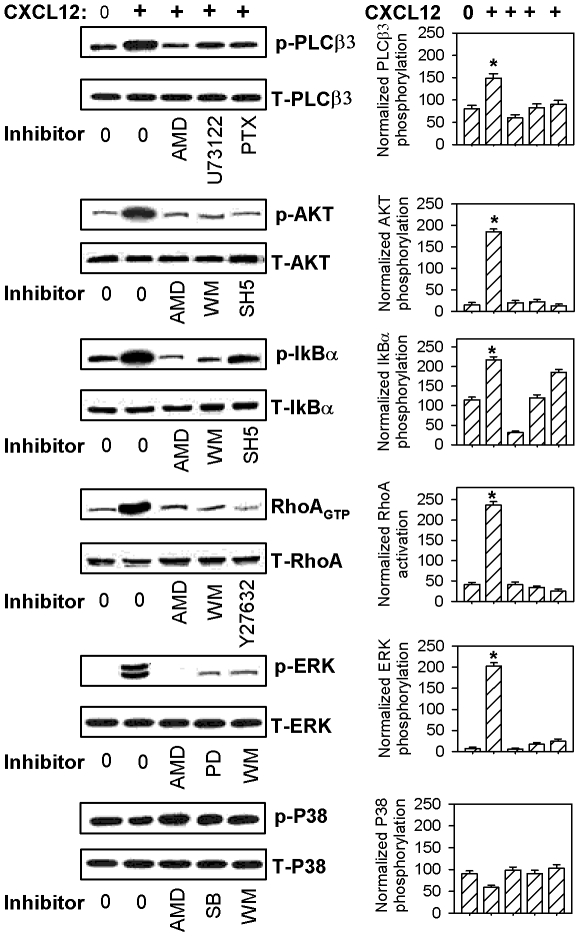
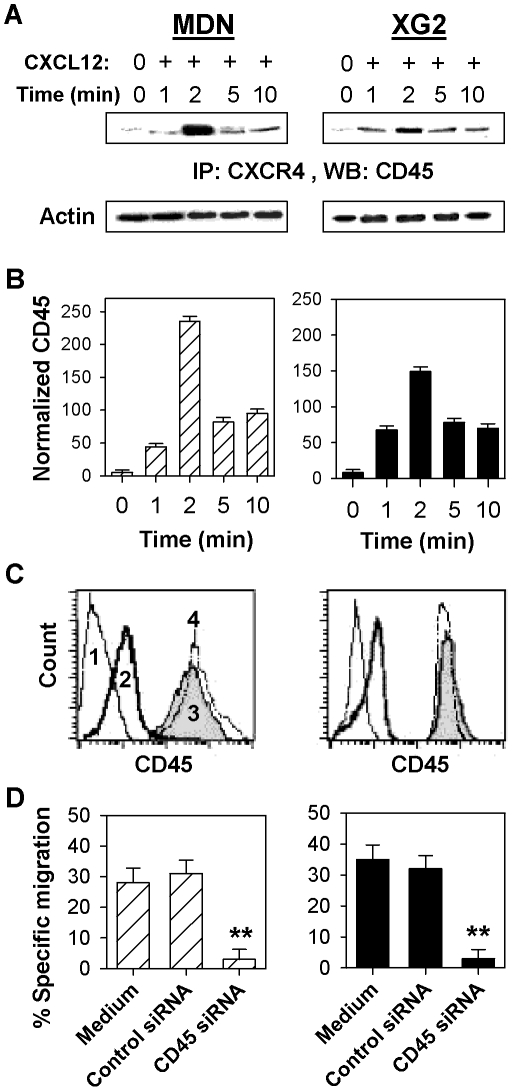
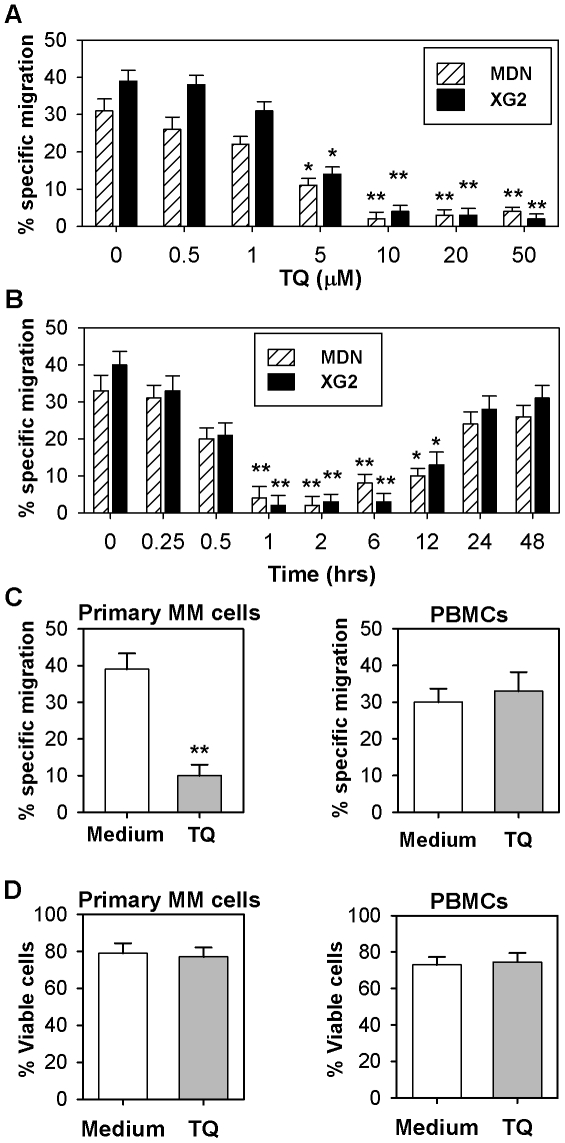
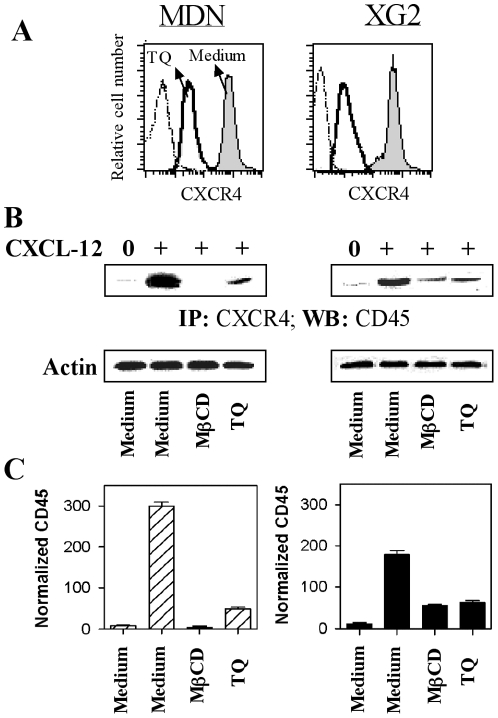
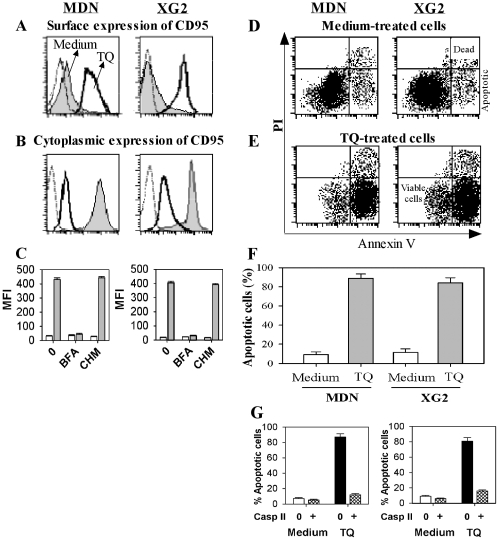
In multiple myeloma (MM), malignant plasma cells reside in the bone marrow, where they accumulate in close contact with stromal cells. The mechanisms responsible for the chemotaxis of malignant plasma cells are still poorly understood. Thus, we investigated the mechanisms involved in the chemotaxis of MDN and XG2 MM cell lines. Both cell lines strongly expressed CCR9, CXCR3 and CXCR4 chemokine receptors but only migrated toward CXCL12. Activation of CXCR4 by CXCL12 resulted in the association of CXCR4 with CD45 and activation of PLCβ3, AKT, RhoA, IκBα and ERK1/2. Using siRNA-silencing techniques, we showed CD45/CXCR4 association is essential for CXCL12-induced migration of MM cells. Thymoquinone (TQ), the major active component of the medicinal herb Nigella sativa Linn, has been described as a chemopreventive and chemotherapeutic compound. TQ treatment strongly inhibited CXCL12-mediated chemotaxis in MM cell lines as well as primary cells isolated from MM patients, but not normal PBMCs. Moreover, TQ significantly down-regulated CXCR4 expression and CXCL12-mediated CXCR4/CD45 association in MM cells. Finally, TQ also induced the relocalization of cytoplasmic Fas/CD95 to the membrane of MM cells and increased CD95-mediated apoptosis by 80%. In conclusion, we demonstrate the potent anti-myeloma activity of TQ, providing a rationale for further clinical evaluation.


Conflict of interest statement

Competing Interests: The authors have declared that no competing interests exist.

Figures

Figure 1
Figure 1. Chemotactic response of MM cells.
Migratory responses of MDN and XG2 cells to the indicated chemokines were determined using Transwell plates. After incubation for 3 h at 37°C, the chemotactic response to CCL3, CCL4, CCL5, CCL25, CXCL9, CXCL10 (all at 500 ng/ml) or CXCL12 (at 250 ng/ml) was determined by flow cytometry. Some cells were pre-incubated for one hour at 37°C with AMD, before being used for the chemotaxis assay in migration medium with 250 ng/ml CXCL12. The experiment was performed in triplicate, and results are expressed as the mean percentage of specific migration ± SEM in response to each chemokine (A). MDN (B) and XG2 (C) cells were incubated for one hour at 37°C with medium, DMSO or various inhibitors, before being used for a chemotaxis assay in migration medium with or without 250 ng/ml CXCL12. Data from six independent experiments is expressed as the mean percentage of inhibition of specific migration ± SEM. PTX = pertussis toxin; SB = SB203580. * P<0.05and ** P<0.001.
Figure 2
Figure 2. CXCL12 induces the phosphorylation of PLCβ3, AKT, ERK1/2, and IκBα and the activation of RhoA in MDN cells.
MDN cells were incubated for one hour at 37°C in medium either with or without various inhibitors (WM used at 1 µM). Cells were then incubated for 2 min with medium or 250 ng/ml CXCL12 prior to being lysed. Proteins in the cell lysates were resolved on a 7% acrylamide gel. The phosphorylation levels of PLCβ3 (p-PLCβ3), ERK1/2 (p-ERK1/2), AKT (p-AKT), IκBα (p- IκBα) and P38 (p-P38) and the activation level of RhoA (RhoAGTP) were corrected for total relevant protein (T-PLCβ3, T-ERK1/2, T-AKT, T- IκBα, T-P38 and T-RhoA) on stripped blots. A representative blot for each downstream effector from 6 independent experiments is shown (left panel); all results are expressed as mean values of normalized specific phosphorylation ± SEM from six separate experiments (right panel). PTX = pertussis toxin; PD = PD98059; SB = SB203580. *P<0.05.
Figure 3
Figure 3. CXCL12-induced interaction of CD45 with CXCR4 is required for MM cell chemotaxis.
(A) MDN and XG2 cells were either unstimulated (0) or stimulated with 250 ng/ml CXCL12 (+), and lysed at the indicated time points following CXCL12 stimulation (in min). Total cells lysates (equivalent to 50 µg of protein) were immunoprecipitated (IP) using a CXCR4 antibody. The immune complexes were resolved on a 7% acrylamide gel, transferred to a nitrocellulose membrane, and immunoblotted with an anti-CD45 antibody. Equal protein loading levels were confirmed by resolving 50 µg of total cell lysates by SDS-PAGE and immunoblotting with an anti-actin antibody. A representative blot from 6 independent experiments is shown. (B) Results from figure 3A are expressed as mean normalized CD45 levels ± SEM from six separate experiments. (C) Untransfected (gray filled histograms; 3), control siRNA-transfected (thin dotted line histograms; 4) and CD45 siRNA-transfected (bold solid line histograms; 2) MDN (left panel) and XG2 (right panel) cells were cultured for 48 hours, stained with an anti-CD45 antibody and analyzed by flow cytometry. Cells stained with an isotype-matched mAb are shown as the negative control (thin solid line histograms; 1). (D) Specific migration of untransfected, control siRNA- and CD45 siRNA-transfected cells was assessed in migration medium with or without 250 ng/ml CXCL12 by flow cytometry. Data is expressed as the mean percentage of specific migration ± SEM from six independent experiments for both MDN (hatched bars) and XG2 (closed black bars) cells. ** P<0.004.
Figure 4
Figure 4. Dose- and time-dependent effects of TQ on CXCL12-mediated MM cell chemotaxis.
(A) MDN (hatched bars) and XG2 (closed black bars) cells were incubated for 2 hours in medium with or without increasing concentrations of TQ, and their chemotactic response to 250 ng/ml CXCL12 was analyzed by flow cytometry. The experiment was performed in triplicate, and results are expressed as the mean percentage of specific migration ± SEM. * P<0.05, ** P<0.02. (B) MDN and XG2 cells were incubated for the indicated time periods with 10 µM TQ prior to assessing their chemotactic response to 250 ng/ml CXCL12. The experiment was performed in triplicate, and results are expressed as the mean percentage of specific migration ± SEM. * P<0.05, ** P<0.02. (C) Primary MM cells isolated from the BM of patients and PBMCs from healthy donors were incubated in R-10 medium for six hours prior to incubation in medium with (gray bars) or without (open bars) 10 µM TQ for one hour at 37°C. Their chemotactic response to 250 ng/ml CXCL12 was subsequently assessed by flow cytometry. The experiment was performed in triplicate with cells from nine different donors, and the results are expressed as the mean percentage of specific migration ± SEM. ** P<0.02. (D) Primary MM cells isolated from the BM of patients and PBMCs from healthy donors were cultured for 6 hours in migration medium before being incubated for one hour at 37°C in medium either with (hatched bars) or without (open bars) TQ. The percentage of viable cells was determined by Annexin-V staining and flow cytomety. Results are expressed as the mean percentage of viable cells ± SEM from nine separate experiments.
Figure 5
Figure 5. TQ decreases CXCR4 expression on MM cells and CXCL12-induced CXCR4/CD45 association.
(A) MDN (left) and XG2 (right) cells were incubated for one hour at 37°C in medium with (bold solid line histograms) or without (gray filled histograms) 10 µM TQ, before being stained with an anti-CXCR4 mAb and analyzed by flow cytometry. Cells stained with an isotype-matched mAb are shown as a negative control (thin dotted line histograms). (B) MDN (left) and XG2 (right) cells were incubated with or without 2 mM MβCD for 30 min at 37°C or 10 µM TQ for one hour prior to incubation for 2 min in medium with (+) or without (0) 250 ng/ml CXCL12. The cells were then lysed and immunoprecipitated (IP) with a CXCR4 antibody. The immune complexes were separated on a 7% SDS-PAGE gel, transferred to a nitrocellulose membrane, and immunoblotted with an anti-CD45 antibody (upper blot). Equal protein loading was confirmed by running 50 µg of the total lysates on a SDS-PAGE gel and immunoblotting using an anti-actin antibody (lower blot). A representative blot from 6 independent experiments is shown. (C) Results from figure 5C are expressed as mean normalized CD45 levels ± SEM from six separate experiments.
Figure 6
Figure 6. TQ increases the surface expression of CD95 and susceptibility of MM cells to Fas-mediated apoptosis.
MDN and XG2 cells were incubated for one hour at 37°C in medium either with (bold solid line histograms) or without (gray filled histograms) 10 µM TQ prior to assessing the levels of extracellular (A) and intracellular (B) CD95 expression by flow cytometry. Cells were stained with an isotype-matched mAb are shown as a negative control (thin line histograms). One representative data set from eight independent experiments is shown. (C) MDN (left) and XG2 (right) cells were incubated for 30 min at 37°C with medium alone (0), 10 µg/ml brefeldin A (BFA) or 1 µM cycloheximide (CHM) prior to incubation for one hour with (gray bars) or without (open bars) 10 µM TQ. CD95 surface expression levels were assessed by flow cytometry and results are expressed as the mean fluorescence intensity (MFI) value ± SEM from nine separate experiments. (D & E) MDN and XG2 cells were incubated for one hour at 37°C in medium either with (E) or without (D) 10 µM TQ prior to starvation for 24 h in the presence of 1 µg/ml agonistic CD95 mAb (clone BG-27). The percentage of cells undergoing apoptosis was determined by flow cytometry based on the PI/Annexin V staining patterns. The percentage of apoptotic cells was consistently below 10% in all cells incubated for 24 h in the presence of a CD95-unrelated mouse isotype control IgG2a. One representative data set from nine independent experiments is shown. (F) Same as (D&E) but the results are expressed as the mean percentage of apoptotic cells ± SEM from nine separate experiments. (G) MDN (left panel) and XG2 (right panel) cells were incubated for one hour at 37°C in medium either with or without 10 µM TQ prior to a further incubation for one hour at 37°C with or without 10 µM Casp II. The cells were then starved for 24 h in the presence of 1 µg/ml B-G27 mAb, and the percentage of apoptotic cells was determined by flow cytometry. The results are expressed as the mean percentage of apoptotic cells ± SEM from nine separate experiments.

References

    1. Kyle RA, Rajkumar SV. Monoclonal gammopathy of undetermined significance and smouldering multiple myeloma: emphasis on risk factors for progression. Br J Haematol. 2007;139:730–743. - PubMed
    1. Kyle RA, Rajkumar SV. Treatment of multiple myeloma: a comprehensive review. Clin Lymphoma Myeloma. 2009;9:278–288. - PMC - PubMed
    1. Jemal A, Siegel R, Ward E, Hao Y, Xu J, et al. Cancer statistics, 2008. CA Cancer J Clin. 2008;58:71–96. - PubMed
    1. Ishii Y, Hsiao HH, Sashida G, Ito Y, Miyazawa K, et al. Derivative (1;7)(q10;p10) in multiple myeloma. A sign of therapy-related hidden myelodysplastic syndrome. Cancer Genet Cytogenet. 2006;167:131–137. - PubMed
    1. Nowakowski GS, Witzig TE, Dingli D, Tracz MJ, Gertz MA, et al. Circulating plasma cells detected by flow cytometry as a predictor of survival in 302 patients with newly diagnosed multiple myeloma. Blood. 2005;106:2276–2279. - PMC - PubMed

Publication types

MeSH terms