

Rational design of temperature-sensitive alleles using computational structure prediction
- PMID: 21912654
- PMCID: PMC3166291
- DOI: 10.1371/journal.pone.0023947
Rational design of temperature-sensitive alleles using computational structure prediction
Abstract
Temperature-sensitive (ts) mutations are mutations that exhibit a mutant phenotype at high or low temperatures and a wild-type phenotype at normal temperature. Temperature-sensitive mutants are valuable tools for geneticists, particularly in the study of essential genes. However, finding ts mutations typically relies on generating and screening many thousands of mutations, which is an expensive and labor-intensive process. Here we describe an in silico method that uses Rosetta and machine learning techniques to predict a highly accurate "top 5" list of ts mutations given the structure of a protein of interest. Rosetta is a protein structure prediction and design code, used here to model and score how proteins accommodate point mutations with side-chain and backbone movements. We show that integrating Rosetta relax-derived features with sequence-based features results in accurate temperature-sensitive mutation predictions.
Conflict of interest statement
Figures
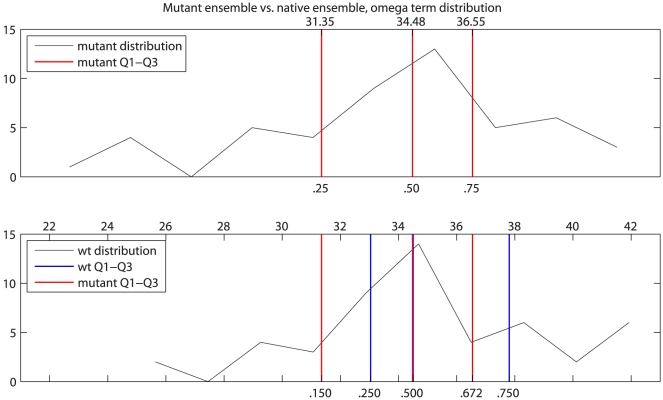
 bond angle from its ideal of
  . Q1–Q3 are indicated by red lines, with the corresponding values above and percentiles below. The mutant Q1–Q3 values were then mapped to locations in the wild type (wt) ensemble distribution (bottom). Q1–Q3 of the mutant distribution are again indicated by red lines, with their percentiles relative to the wt distribution shown below. Wild type ensemble Q1–Q3 are shown in blue for reference.
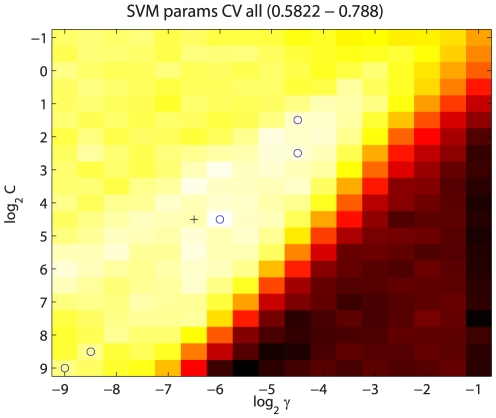
 and
and  parameters. Values shown are the mean across the five leave-out CV runs, and range from 0.5822 to 0.788. Blue circles indicate the parameter values yielding the highest ts precision for each of the five leave-out CV runs. The final median
  and
and  values are indicated by the black cross. While the optimum parameter values across the five leave-out CV runs differ, they are all located along the “valley” of high precision that is visible running from upper right to lower left, indicating that multiple combinations of
  and
and  values lead to classifiers having similarly good performance.
References
-
- Dohmen RJ, Wu P, Varshavsky A. Heat-inducible degron: a method for constructing temperature-sensitive mutants. Science. 1994;263:1273–6. - PubMed
-
- Cunningham B, Wells J. High-resolution epitope mapping of hgh-receptor interactions by alanine-scanning mutagenesis. Science. 1989;244:1081–1085. - PubMed
-
- Bajaj K, Dewan PC, Chakrabarti P, Goswami D, Barua B, et al. Structural correlates of the temperature sensitive phenotype derived from saturation mutagenesis studies of ccdb. Biochemistry. 2008;47:12964–73. - PubMed
Publication types
MeSH terms
Substances
Grants and funding
LinkOut - more resources
Full Text Sources
