

Behaviour of human erythrocyte aggregation in presence of autologous lipoproteins
- PMID: 21912746
- PMCID: PMC3170799
- DOI: 10.1155/2012/261736
Behaviour of human erythrocyte aggregation in presence of autologous lipoproteins
Abstract
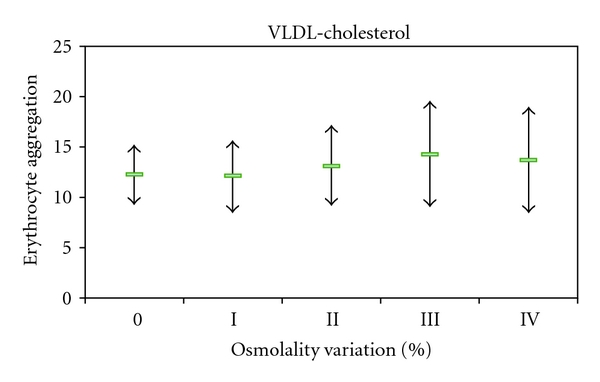
The aim of this work was to evaluate in vitro the effect of autologous plasma lipoprotein subfractions on erythrocyte tendency to aggregate. Aliquots of human blood samples were enriched or not (control) with their own HDL-C, LDL-C, or VLDL-C fractions obtained from the same batch by density gradient ultracentrifugation. Plasma osmolality and erythrocyte aggregation index (EAI) were determined. Blood aliquots enriched with LDL-C and HDL-C showed significant higher EAI than untreated aliquots, whereas enrichment with VLDL-C does not induce significant EAI changes. For the same range of lipoprotein concentrations expressed as percentage of osmolality variation, the EAI variation was positive and higher in presence of HDL-C than upon enrichment with LDL-C (P < 0.01). Particle size, up to LDL diameter values, seems to reinforce erythrocyte tendency to aggregate at the same plasma osmolality (particle number) range of values.
Figures


References
-
- Kannel WB, Castelli WP, Gordon T. Cholesterol in the prediction of atherosclerotic disease: new perspectives based on the Framingham study. Annals of Internal Medicine. 1979;90(1):85–91. - PubMed
-
- Baigent C, Keech A, Kearney PM, Blackwell L, Buck G. Efficacy and safety of cholesterol-lowering treatment prospective meta-analysis of data from 90,056 participants in 14 randomised trials of statins. The Lancet. 2005;366:1267–1278. - PubMed
-
- Robinson JG, Smith B, Maheshwari N, Schrott H. Pleiotropic effects of statins: benefit beyond cholesterol reduction? A meta-regression analysis. Journal of the American College of Cardiology. 2005;46(10):1855–1862. - PubMed
LinkOut - more resources
Full Text Sources
