. 2012 Jan;40(1):148-58.
doi: 10.1093/nar/gkr720. Epub 2011 Sep 13.

Integrated genome-wide analysis of transcription factor occupancy, RNA polymerase II binding and steady-state RNA levels identify differentially regulated functional gene classes

Affiliations

Integrated genome-wide analysis of transcription factor occupancy, RNA polymerase II binding and steady-state RNA levels identify differentially regulated functional gene classes

Michal Mokry et al. Nucleic Acids Res. 2012 Jan.

Abstract

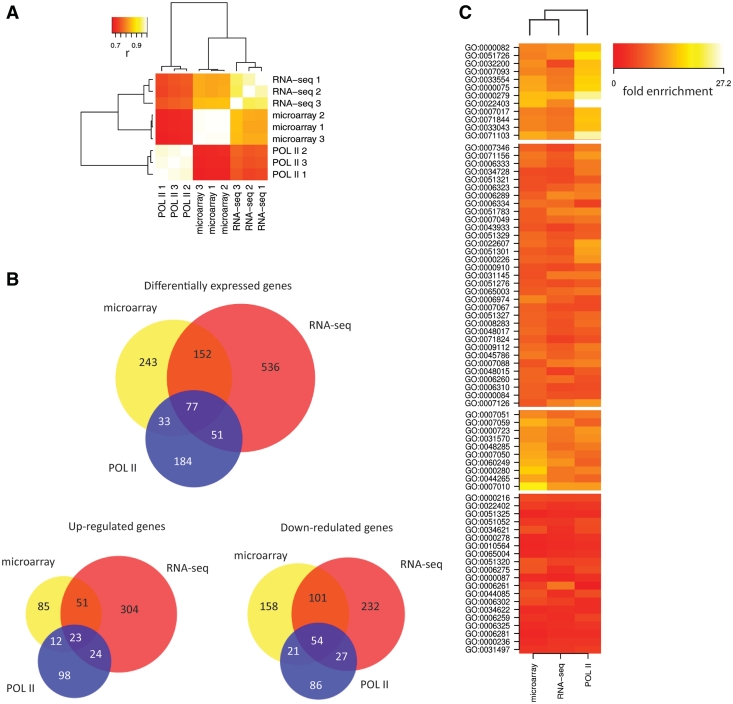
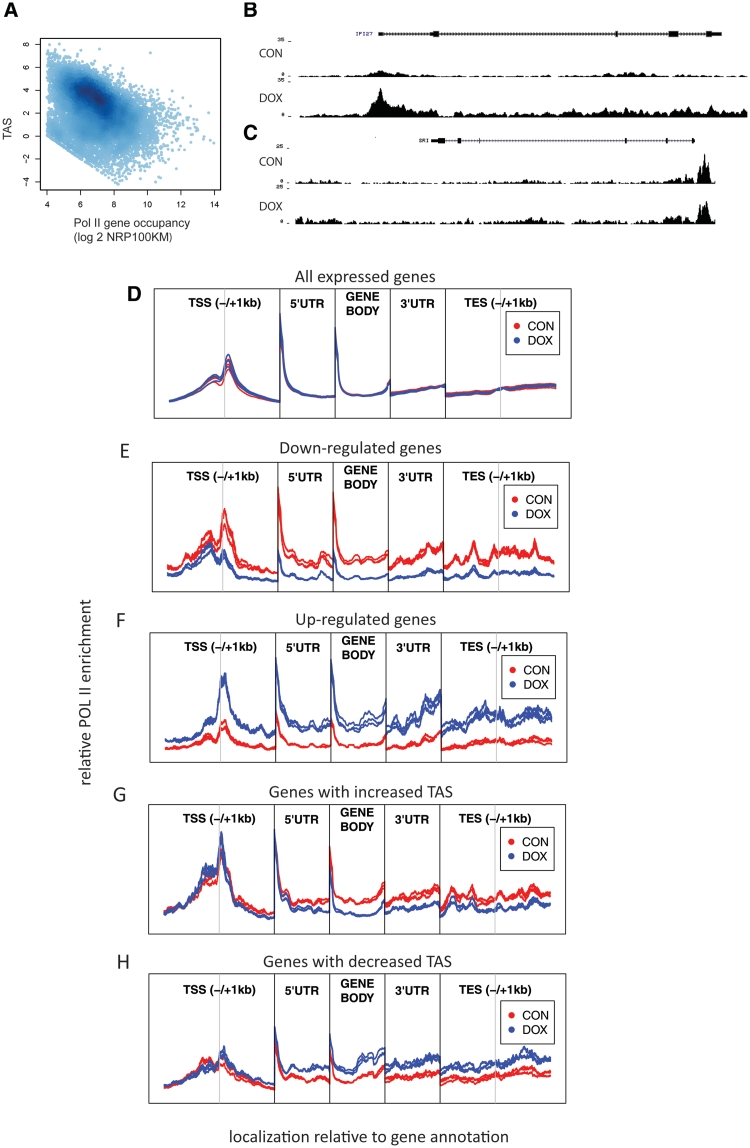
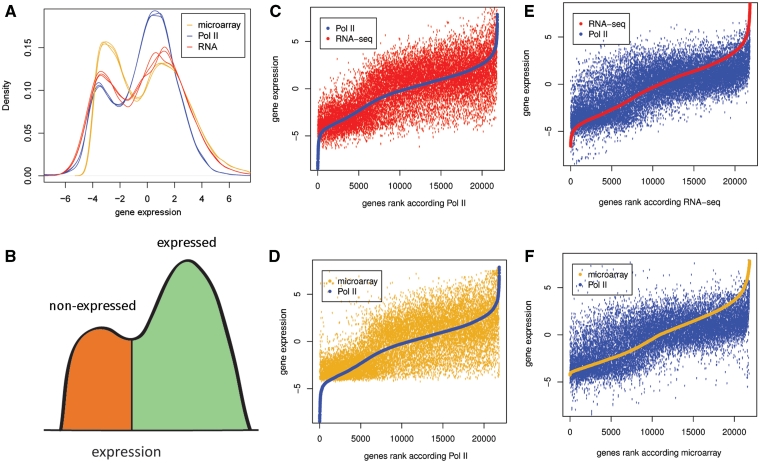
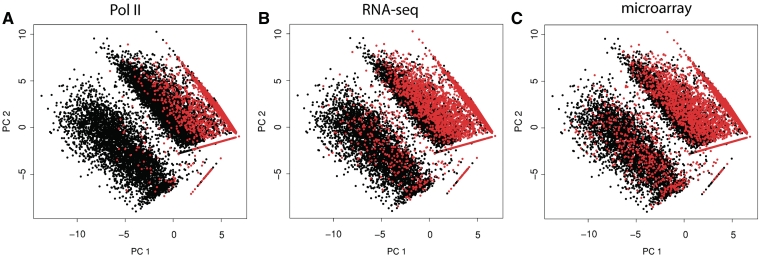
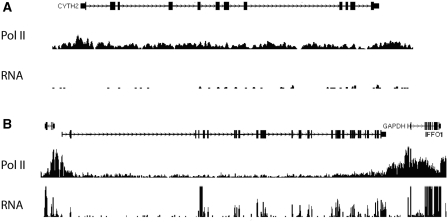
Routine methods for assaying steady-state mRNA levels such as RNA-seq and micro-arrays are commonly used as readouts to study the role of transcription factors (TFs) in gene expression regulation. However, cellular RNA levels do not solely depend on activity of TFs and subsequent transcription by RNA polymerase II (Pol II), but are also affected by RNA turnover rate. Here, we demonstrate that integrated analysis of genome-wide TF occupancy, Pol II binding and steady-state RNA levels provide important insights in gene regulatory mechanisms. Pol II occupancy, as detected by Pol II ChIP-seq, was found to correlate better with TF occupancy compared to steady-state RNA levels and is thus a more precise readout for the primary transcriptional mechanisms that are triggered by signal transduction. Furthermore, analysis of differential Pol II occupancy and RNA-seq levels identified genes with high Pol II occupancy and relatively low RNA levels and vice versa. These categories are strongly enriched for genes from different functional classes. Our results demonstrate a complementary value in Pol II chip-seq and RNA-seq approaches for better understanding of gene expression regulation.


Figures

Figure 1.
Figure 1.
Comparison of Pol II ChIP-seq, RNA-seq and microarrays. (A) Clustering of three different methods (RNA-seq, gene-expression microarray, Pol-II ChIP-seq) and biological replicates based on correlations of absolute gene-expression levels as measured by Pol II occupancy, RNA-seq and normalized probe intensities from microarrays. (B) Overlap between differentially expressed genes as determined by POL II occupancy, RNA-seq and microarrays. (C) Gene ontology analysis of down-regulated genes (Wnt target genes) identified by the same three methods. Each displayed term was found significantly enriched by at least one method. Functional classes in the first cluster are less enriched in genes identified by methods based on measuring RNA-levels, compared to genes identified based on POL II occupancy.
Figure 2.
Figure 2.
Linear regression analysis of Pol II occupancy, RNA-seq and microarray probe intensities with (A) transcription factor occupancy represented by individual TTAS scores separately for each transcription factor and with (B) individual principal components extracted from TTAS of five transcription factors. TTAS scores reflect the likelihood of a gene being regulated by a given transcription factor. (C) Loadings of TTAS scores in the four major principal components that explain most of the variability in Pol II occupancy. Individual loadings were multiplied by −1 when the correlation of principal component with Pol II occupancy was negative.
Figure 3.
Figure 3.
Poised polymerase and metagene analysis of Pol II occupancy. (A) Correlation of total Pol II occupancy with TAS score. The TAS score represents the relative enrichment of POL II at the promoter compared to the gene body and reflects the fraction of poised polymerase. Genes with lower expression have more Pol II deposited on their transcription start site and less processing polymerase in the gene body compared to genes with higher expression (r = −366). (B, C) Pol II coverage for up-regulated genes with (B) increased density over TSS and gene body and (C) increased density in gene body without change in TSS. (D) Relative enrichment of POL II sequencing tags in Wnt plus (CON) and Wnt minus (DOX) samples with respect to gene annotation in (D) all annotated genes (E) down-regulated and (F) up-regulated genes. POL II enrichment changes simultaneously in TSS and gene body, suggesting that a substantial proportion of transcription regulation is mediated by changes in POL II recruitment. In subclass of genes, with increase (G) or decrease (H) in relative enrichment of POL II at the promoter compared to gene body; difference of POL II accumulation in downstream part of genes is not accompanied by change in enrichment on TSS. Every individual region is normalized separately against input and average enrichment of CON samples.
Figure 4.
Figure 4.
Bimodal distribution of Pol II occupancy, RNA-seq and microarray probe intensities (A) All methods reveal a bimodal pattern of gene expression indicative of (B) expressed (green) and non-expressed (red) genes. (C–F) Rank analysis of Pol II occupancy, RNA-seq and microarray probe intensities. Genes are ranked according to Pol II ChIP-seq results (C, D), according to RNA-seq (E) or microarrays (F). Many transcripts classified as expressed according the Pol II ChIP-seq are called as not expressed according to the RNA-seq and microarray data. In contrast, only a very limited number of transcripts that are called transcribed by RNA-seq and microarrays are called as non-transcribed by Pol II ChIP-seq. All expression values represent median centered and log2 transformed NR100KM (Pol II), NR10KM (RNA-seq) and normalized microarray probe intensity.
Figure 5.
Figure 5.
Clustering of expressed (black) and non-expressed (red) genes defined by POL II chip-seq, RNA-seq and microarrays. Genes are plotted according to principal components extracted from TTAS scores, which reflect the likelihood of a gene being regulated by a given transcription factor. Genes categorized into expressed and non-expressed according to bimodal distribution of Pol II results (A) form more defined clusters compared to genes categorized according to RNA levels (B and C).
Figure 6.
Figure 6.
Examples of Pol II and RNA-seq coverage over of genes with low (A) and high (B) RNA stability. The vertical axis represents relative sequencing tag coverage per position (A) A gene (CYTH2) with high density of sequencing tags over the gene body with very low levels of RNA. Pol II ChIP-seq classifies the depicted gene as expressed; however, both RNA-seq and microarrays classify the gene as non-expressed (Class I gene). (B) Genes (IFFO1 and GAPDH) with high density of Pol II ChIP-seq tags mapping to the gene body and with high numbers of sequencing RNA-seq tags mapping to annotated exons.

References

    1. Shyu AB, Wilkinson MF, van Hoof A. Messenger RNA regulation: to translate or to degrade. EMBO J. 2008;27:471–481. - PMC - PubMed
    1. Raghavan A, Ogilvie RL, Reilly C, Abelson ML, Raghavan S, Vasdewani J, Krathwohl M, Bohjanen PR. Genome-wide analysis of mRNA decay in resting and activated primary human T lymphocytes. Nucleic Acids Res. 2002;30:5529–5538. - PMC - PubMed
    1. Sharova LV, Sharov AA, Nedorezov T, Piao Y, Shaik N, Ko MS. Database for mRNA half-life of 19 977 genes obtained by DNA microarray analysis of pluripotent and differentiating mouse embryonic stem cells. DNA Res. 2009;16:45–58. - PMC - PubMed
    1. Wang Y, Liu CL, Storey JD, Tibshirani RJ, Herschlag D, Brown PO. Precision and functional specificity in mRNA decay. Proc. Natl Acad. Sci. USA. 2002;99:5860–5865. - PMC - PubMed
    1. Garcia-Martinez J, Aranda A, Perez-Ortin JE. Genomic run-on evaluates transcription rates for all yeast genes and identifies gene regulatory mechanisms. Mol. Cell. 2004;15:303–313. - PubMed

Publication types