. 2011 Nov 4;286(44):38043-38053.
doi: 10.1074/jbc.M111.245449. Epub 2011 Sep 13.

The mechanism of insulin-stimulated 4E-BP protein binding to mammalian target of rapamycin (mTOR) complex 1 and its contribution to mTOR complex 1 signaling

Affiliations

The mechanism of insulin-stimulated 4E-BP protein binding to mammalian target of rapamycin (mTOR) complex 1 and its contribution to mTOR complex 1 signaling

Joseph Rapley et al. J Biol Chem. .

Abstract

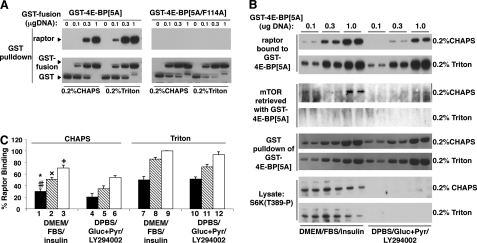
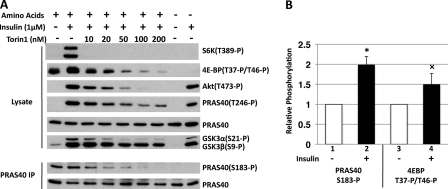
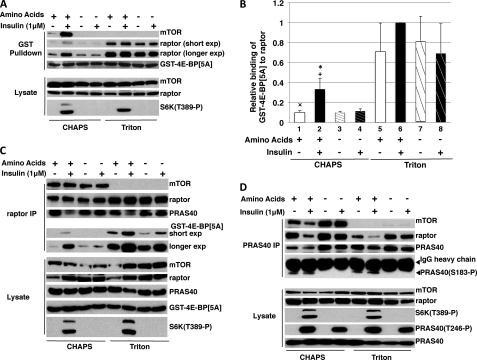
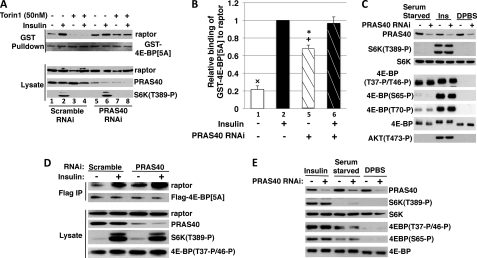
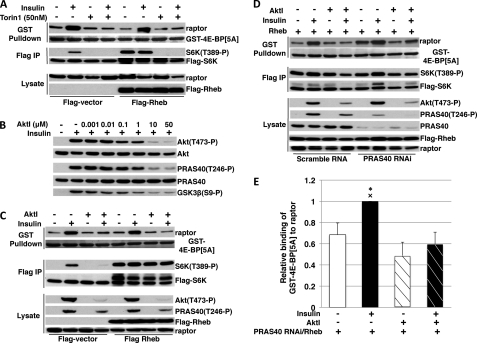
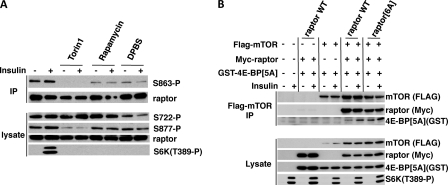
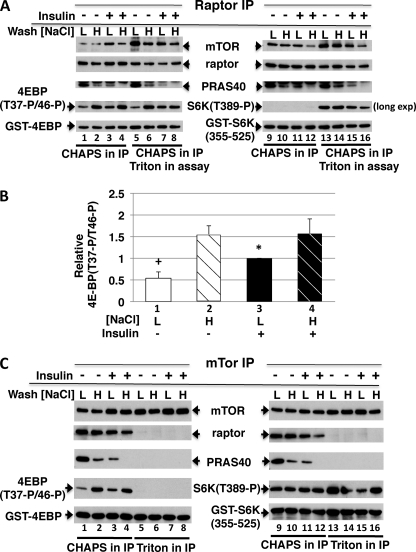
Insulin activation of mTOR complex 1 is accompanied by enhanced binding of substrates. We examined the mechanism and contribution of this enhancement to insulin activation of mTORC1 signaling in 293E and HeLa cells. In 293E, insulin increased the amount of mTORC1 retrieved by the transiently expressed nonphosphorylatable 4E-BP[5A] to an extent that varied inversely with the amount of PRAS40 bound to mTORC1. RNAi depletion of PRAS40 enhanced 4E-BP[5A] binding to ∼70% the extent of maximal insulin, and PRAS40 RNAi and insulin together did not increase 4E-BP[5A] binding beyond insulin alone, suggesting that removal of PRAS40 from mTORC1 is the predominant mechanism of an insulin-induced increase in substrate access. As regards the role of increased substrate access in mTORC1 signaling, RNAi depletion of PRAS40, although increasing 4E-BP[5A] binding, did not stimulate phosphorylation of endogenous mTORC1 substrates S6K1(Thr(389)) or 4E-BP (Thr(37)/Thr(46)), the latter already ∼70% of maximal in amino acid replete, serum-deprived 293E cells. In HeLa cells, insulin and PRAS40 RNAi also both enhanced the binding of 4E-BP[5A] to raptor but only insulin stimulated S6K1 and 4E-BP phosphorylation. Furthermore, Rheb overexpression in 293E activated mTORC1 signaling completely without causing PRAS40 release. In the presence of Rheb and insulin, PRAS40 release is abolished by Akt inhibition without diminishing mTORC1 signaling. In conclusion, dissociation of PRAS40 from mTORC1 and enhanced mTORC1 substrate binding results from Akt and mTORC1 activation and makes little or no contribution to mTORC1 signaling, which rather is determined by Rheb activation of mTOR catalytic activity, through mechanisms that remain to be fully elucidated.


Figures

FIGURE 1.
FIGURE 1.
The binding of GST-4E-BP[5A] to raptor is regulated by cell state. A, binding of 4E-BP[5A]or 4E-BP[5Ala/F114A] (F114A inactivates the TOS motif) to raptor in different detergents. 293T cells were co-transfected with GST-tagged 4E-BP[5A]or GST-tagged 4E-BP[5Ala/F114A] with empty vector at varying plasmid quantities. 40 h post-transfection cells were lysed in either CHAPS or Triton lysis buffer and lysates were subjected to a GST pulldown assay. Membranes were analyzed using the anti-raptor and anti-GST antibodies. B, effect of amino acid withdrawal, insulin, and detergent on GST-4E-BP[5A] association with raptor. 293T cells were transfected with varying amounts of GST-tagged 4E-BP[5A]. Forty h later the medium was changed to DMEM/insulin (1 μm)/10% FBS or DPBS/glucose (25 mm)/pyruvate (1 mm)/LY294002 (10 μm). Cells were lysed in a buffer containing either 0.2% CHAPS or 0.2% Triton and lysates were subjected to a GSH-Sepharose pulldown assay. Membranes were analyzed by anti-mTOR, anti-raptor, and anti-S6K-Thr389-P antibodies; GST-4E-BP[5A] was detected by Coomassie Blue staining. C, graphical representation of B, black bars represent 0.1 μg of DNA; hatched bars, 0.3 μg of DNA; and white bars, 1.0 μg of DNA. Mean ± S.E. from three experiments, each performed in replicate. #, p < 0.05, lane 1 versus 4; *, p < 0.01, lane 1 versus 7 and 10; ×, p < 0.01, lane 2 versus 5, 8, and 11; +, p < 0.01, lane 3 versus 6, 9, and 12; lane 7 versus 10, lane 8 versus 11, and lane 9 versus 12 all ns.
FIGURE 2.
FIGURE 2.
The effect of insulin, amino acids, and Torin1 on mTOR signaling in 293E cells. A, 293E cells serum starved overnight were stimulated with insulin in the presence or absence of varying concentrations of Torin1; some cells were transferred to DPBS 1 h prior to insulin stimulation. Cells were lysed in a lysis buffer containing 0.2% CHAPS and aliquots were subjected to PRAS40 immunoprecipitation. After SDS-PAGE and electroblot, membranes were analyzed by anti-S6K-Thr389-P, anti-4EBP1-Thr37-P/Thr46-P, anti-AKT-Thr473-P, anti-PRAS40-Thr246-P, anti-PRAS40, anti-GSK3β-Ser9-P, and anti-PRAS40-Ser183-P antibodies. B, graphical representation of the effect of insulin on PRAS40-Ser183 and 4E-BP-Thr37/Thr46 phosphorylation. White bars, serum starvation; black bars, insulin. Mean ± 1 S.D. of three experiments. *, p < 0.01, lane 1 versus 2; ×, p < 0.05, lane 3 versus 4.
FIGURE 3.
FIGURE 3.
The effect of insulin and amino acids on the binding of transiently expressed GST-4E-BP[5A] and endogenous PRAS40 in vivo to endogenous mTORC1 and free raptor. A, the ability of transiently expressed GST-4E-BP[5A] to retrieve endogenous mTORC1 and free raptor from 293E cells. 293E cells were transfected with 1 μg of GST-4E-BP[5A] and stimulated by insulin in DMEM or after incubation in DPBS for 60 min as described under “Materials and Methods.” Cells were extracted in a buffer containing either 0.2% CHAPS or 0.2% Triton and subjected to a GSH-Sepharose pulldown assay. After SDS-PAGE, membranes were analyzed by immunoblot as described in the legend to Fig. 1B. B, graphical representation (mean ± 1 S.D.) of the combined results from three experiments as shown in A; white bars, serum starvation; black bars, insulin; and hatched bars, DPBS. ×, p < 0.02, lane 1 versus 2 and 5; +, p < 0.05, lane 2 versus 3 and 4; *, p < 0.001, lane 2 versus 6; lane 5 versus 6–8, all non-significant. C, the effect mTOR removal from mTORC1 on the ability of raptor to bind transiently expressed GST-4E-BP[5A] and endogenous PRAS40. The experiments were performed as described in the legend to Fig. 2A except that endogenous raptor was immunoprecipitated. D, the effect of insulin and amino acid withdrawal on the binding of endogenous PRAS40 to endogenous raptor. The experiments were performed as described in the legend to Fig. 2A except that endogenous PRAS40 was immunoprecipitated.
FIGURE 4.
FIGURE 4.
RNAi-induced depletion of PRAS40 from 293E cells increases mTORC1 binding to GST-4E-BP[5A] but not mTORC1 signaling. A, the effect of insulin and PRAS40 RNAi on mTORC1 binding to GST-4E-BP[5A]. 293E cells were co-transfected with 2 μg of GST-4E-BP[5A] and 120 pmol of siRNA (scrambled or PRAS40-directed) and stimulated by insulin in DMEM or ± preincubation with Torin1 (50 nm) as described under “Materials and Methods.” Cells were extracted in a buffer containing 0.2% CHAPS and subjected to a GSH-Sepharose pulldown assay. After SDS-PAGE, membranes were analyzed by immunoblot as described in the legend to Fig. 1B. B, graphical representation of three experiments as described in A (mean ± 1 S.D.) showing the effect of insulin (lanes 1 versus 2 and 5 versus 6) and PRAS40 RNAi (lanes 1 and 2 versus 5 and 6) on GST-4E-BP[5A] binding to intact mTORC1 in 293E cells in DMEM; white bars, serum starved; black bars, insulin; and hatched bars, PRAS40 RNAi. ×, p < 0.001, lane 1 versus 2, 5, and 6; +, p < 0.001, lane 5 versus 2; *, p < 0.01, lane 5 versus 6; lane 2 versus 6, non-significant. C, the effect of RNAi-induced PRAS40 depletion on the phosphorylation of endogenous 4E-BP(Thr37/Thr46) and PRAS40(Ser183) in 293E cells. 293E cells were treated as in A and extracts were analyzed by immunoblot after SDS-PAGE. D, the effect of insulin and PRAS40 RNAi on mTORC1 binding to FLAG-4E-BP1[5A] in HeLa cells. Scrambled or PRAS40-directed RNAi (480 pmol) followed by FLAG-tagged 4E-BP1[5A] (5 μg) were transfected into HeLa cells. After 48 h, cells deprived of serum for 1 h were stimulated by insulin or carrier, extracted in buffer containing 0.2% CHAPS, and subjected to FLAG immunoprecipitation. Immunoblots of the FLAG IP and lysate are shown. Another experiment gave very similar results. E, the effect of RNAi-induced PRAS40 depletion on the phosphorylation of endogenous 4E-BP and S6K in HeLa cells. Forty eight h after introduction of PRAS40 or scramble RNAi, cells were transferred to DMEM without serum or to DPBS + glucose and pyruvate; 1 h later, the DMEM was changed to fresh DMEM (serum starved) or DMEM + insulin (1 μm; insulin) and the DPBS + glucose and pyruvate was replaced with fresh DPBS + glucose and pyruvate (DPBS). Cells were harvested 30 min later and analyzed by immunoblot after SDS-PAGE as shown.
FIGURE 5.
FIGURE 5.
The effect of Rheb ± an AKT inhibitor on GST-4E-BP[5A] binding to endogenous mTORC1 and on mTORC1 signaling. A, recombinant Rheb activates mTORC1 signaling without altering mTORC1 binding of GST-4EBP[5A]. 293E cells were transfected with 1 μg of GST-4E-BP[5A], 500 ng of FLAG-S6K, and 2 μg of FLAG-Rheb or 2 μg of FLAG vector. Cells were serum starved overnight and preincubated ± Torin1 for 1 h, followed by treatment with insulin as described under “Materials and Methods.” Cells were extracted in lysis buffer containing 0.2% CHAPS and aliquots of the extract were subjected to a GSH-Sepharose pulldown and FLAG immunoprecipitation. After SDS-PAGE and blot transfer, membranes were analyzed by immunoblot as shown; GST-4E-BP[5A] was visualized by Coomassie Blue staining. B, the effect of Akt inhibitor VIII, isozyme selective, Akti-1/2 on AKT(Ser473) phosphorylation and Akt signaling in 293E cells. Serum-starved 293E cells were preincubated with the Akt inhibitor at the concentrations shown, then stimulated with insulin. Cells were extracted in a lysis buffer containing 0.2% CHAPS, extracts were subjected to SDS-PAGE, and membranes were analyzed by immunoblot as indicated. C, the Akt inhibitor VIII inhibits the insulin-stimulated binding of GST-4E-BP[5A] to mTORC1 in the presence and absence of recombinant Rheb but does not inhibit Rheb-stimulated mTORC1 signaling. 293E cells were transfected with 1 μg of GST-4E-BP[5A], 500 ng of FLAG-S6K, and 2 μg of FLAG-Rheb or 2 μg of FLAG vector. Cells were preincubated for 1 h ± Akt inhibitor VIII (30 μm) and then treated with or without insulin. Aliquots of cell extracts lysed with 0.2% CHAPS were subjected to GSH-Sepharose pulldown and FLAG immunoprecipitation and processed for immunoblot as described A. D, the component of insulin-stimulated GST-4E-BP[5A] binding to mTORC1 remaining in 293E cells depleted of PRAS40 is suppressed by the Akt inhibitor. 293E cells were co-transfected with 1 μg of FLAG-Rheb, 1 μg of GST-4E-BP[5A], 500 ng of FLAG-S6K, and 145 pmol of scrambled or PRAS40-directed siRNA. Cells were serum starved and preincubated with or without Akt inhibitor VIII (30 μm) for 1 h and then treated with or without insulin. Aliquots of cell extracts lysed with 0.2% CHAPS were subjected to GSH-Sepharose pulldown and FLAG immunoprecipitation and processed for immunoblot as in Fig. 5A. E, graphical representation of the data (mean ± 1 S.D.) from four experiments performed as described for the four right-most lanes of D, showing the effects of Akt inhibitor on the basal and insulin-stimulated binding of mTORC1 to GST-4E-BP[5A] in 293E cells depleted of PRAS40 and expressing recombinant Rheb. White bars, serum starvation; black bars, insulin; hatched bars, AKT inhibitor. ×, p < 0.01, second lane versus first; *, p < 0.001, second lane versus third and fourth; first lane versus third and fourth, non-significant.
FIGURE 6.
FIGURE 6.
Mutation of multiple raptor phosphorylation sites does not impair insulin-stimulated binding of GST-4E-BP[5A] to recombinant mTORC1. A, analysis of raptor phosphorylation in 293E cells. 293E cells were serum starved and cells were treated with or without insulin after preincubation with Torin1 (200 nm, 1 h), rapamycin (200 nm,1 h), or DPBS (1 h). Aliquots of extracts were subjected to a raptor IP and the extracts and IPs were subjected to SDS-PAGE and immunoblot with anti-raptor, anti-raptor-Ser863-P, anti-raptor-Ser722-P, anti-raptor-Ser877-P, and anti-S6K-Thr389-P antibodies. B, recombinant mTORC1 containing raptor mutant at six phosphorylation sites is unimpaired in its ability to bind GST-4E-BP[5A] in serum-deprived or insulin-stimulated 293E cells. 293E cells were transfected with 1 μg of FLAG-tagged mTOR and/or FLAG vector, 500 ng of Myc-raptor WT or Myc-raptor[6A] and/or Myc vector and 1 μg of GST-tagged 4E-BP[5A] and/or GST vector as indicated. Serum-starved cells were treated with insulin, extracted in a lysis buffer containing 0.2% CHAPS, and subjected to a FLAG immunoprecipitation. The lysates and FLAG immunoprecipitates were subjected to SDS-PAGE and the membranes were analyzed using anti-FLAG, anti-Myc, anti-GST, anti-raptor, and anti-S6K-Thr389-P antibodies.
FIGURE 7.
FIGURE 7.
In vitro kinase assay of mTOR and mTORC1. A, the effect of insulin pretreatment and a high salt wash on the ability of a raptor immunoprecipitate to phosphorylate 4E-BP or TOS-less S6K(355–525) fragment in vitro. Serum-deprived 293E cells were treated with or without insulin, extracted in CHAPS-containing buffer, and subjected to a raptor immunoprecipitation. The immunoprecipitates were washed in CHAPS-containing buffer supplemented with 0.15 or 0.4 m NaCl and a kinase assay was performed with or without addition of 1% Triton X-100, using 200 ng of either GST-4EBP (left) or GST-S6K(355–525) (right) as substrate as described under “Materials and Methods.” After SDS-PAGE, the membranes were immunoblotted as indicated. Note that although raptor content is unaltered by addition of Triton, a partial dissociation of raptor from mTOR is achieved by Triton. B, quantitation of the effects of insulin pretreatment and NaCl wash (0.15 m = L, 0.4 m = H) on the ability of the raptor IP to catalyze the phosphorylation of GST-4E-BP in vitro. The results represent four experiments (mean ± 1 S.D.) corresponding to lanes 1–4 in A. +, p < 0.01, lane 1 versus 2–4; *, p < 0.05, lane 3 versus 2 and 4; lane 2 versus 4, non-significant. C, the effect of insulin pretreatment and a high salt wash on the ability of an mTOR immunoprecipitate to phosphorylate 4E-BP or the TOS-less S6K(355–525) fragment in vitro. Serum-deprived 293E cells were treated with or without insulin, extracted in either a CHAPS-containing or a Triton-containing buffer, and subjected to mTOR immunoprecipitation. The immunoprecipitates were washed in the lysis buffer supplemented with 0.15 m (L) or 0.4 m NaCl (H) and a kinase assay was performed using either GST-4E-BP (left) or GST-S6K(355–525) (right) as substrate and analyzed as in A. Note that the pattern of 4E-BP phosphorylation by the mTOR IP extracted in CHAPS corresponds to that of the raptor IP, whereas mTOR extracted in Triton does not phosphorylate GST-4E-BP but avidly phosphorylates GST-S6K(355–525) in an insulin- and NaCl-independent manner.

Similar articles

Cited by

References

    1. Wullschleger S., Loewith R., Hall M. N. (2006) Cell 124, 471–484 - PubMed
    1. Hara K., Maruki Y., Long X., Yoshino K., Oshiro N., Hidayat S., Tokunaga C., Avruch J., Yonezawa K. (2002) Cell 110, 177–189 - PubMed
    1. Kim D. H., Sarbassov D. D., Ali S. M., King J. E., Latek R. R., Erdjument-Bromage H., Tempst P., Sabatini D. M. (2002) Cell 110, 163–175 - PubMed
    1. Loewith R., Jacinto E., Wullschleger S., Lorberg A., Crespo J. L., Bonenfant D., Oppliger W., Jenoe P., Hall M. N. (2002) Mol. Cell. 10, 457–468 - PubMed
    1. Wang L., Rhodes C. J., Lawrence J. C., Jr. (2006) J. Biol. Chem. 281, 24293–24303 - PubMed

Publication types

MeSH terms

LinkOut - more resources