. 2011 Sep 27;108(39):16271-6.
doi: 10.1073/pnas.1109409108. Epub 2011 Sep 13.

Repressor transcription factor 7-like 1 promotes adipogenic competency in precursor cells

Affiliations

Repressor transcription factor 7-like 1 promotes adipogenic competency in precursor cells

Ana G Cristancho et al. Proc Natl Acad Sci U S A. .

Abstract

The identification of factors that define adipocyte precursor potential has important implications for obesity. Preadipocytes are fibroblastoid cells committed to becoming round lipid-laden adipocytes. In vitro, this differentiation process is facilitated by confluency, followed by adipogenic stimuli. During adipogenesis, a large number of cytostructural genes are repressed before adipocyte gene induction. Here we report that the transcriptional repressor transcription factor 7-like 1 (TCF7L1) binds and directly regulates the expression of cell structure genes. Depletion of TCF7L1 inhibits differentiation, because TCF7L1 indirectly induces the adipogenic transcription factor peroxisome proliferator-activated receptor γ in a manner that can be replaced by inhibition of myosin II activity. TCF7L1 is induced by cell contact in adipogenic cell lines, and ectopic expression of TCF7L1 alleviates the confluency requirement for adipocytic differentiation of precursor cells. In contrast, TCF7L1 is not induced during confluency of non-adipogenic fibroblasts, and, remarkably, forced expression of TCF7L1 is sufficient to commit non-adipogenic fibroblasts to an adipogenic fate. These results establish TCF7L1 as a transcriptional hub coordinating cell-cell contact with the transcriptional repression required for adipogenic competency.


Conflict of interest statement

The authors declare no conflict of interest.

Figures
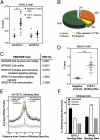
Fig. 1.
Fig. 1.
TCF7L1 represses cytostructural genes during adipocyte differentiation. (A) Validation of TCF7L1-binding sites from ChIP-seq. TCF7L1 ChIP-qPCR in control cells and TCF7L1-depleted 3T3-L1 cells at 24 h after the addition of adipogenic stimull (DMI; see SI Materials and Methods). (B) Distribution of TCF7L1-binding sites throughout the genome. (C) TCF7L1 binds near genes in cell structure pathways. PANTHER biological processes enriched with an FDR <5% for all genes within 100 kb of TCF7L1-binding sites. (D) HDAC1 colocalizes with TCF7L1. HDAC1 ChIP-qPCR in 3T3-L1 cells during early adipogenesis. (E) Reduced H3K9Ac at TCF7L1-binding sites. Average H3K9ac profile at TCF7L1-binding sites in day 0 preadipocytes, at 24 h after addition of DMI, and in day 10 mature adipocytes. The profile of input for each time point was determined as well. The one-tailed Wilcoxon rank-sum test was used to compare the difference in acetylation at TCF7L1-binding sites with acetylation at matched control regions in a 1-kb region. P < 0.05, preadipocyte > 24 h after DMI > adipocytes. (F) TCF7L1 binding is increased at genes repressed during adipogenesis. Percentage of TCF7L1 and PPARγ-binding sites within 100 kb of genes repressed (1,406 genes) or induced during adipogenesis (1,011 genes) or a random set of genes (1,366 genes). Fisher's exact test was used to compare the percentage of TCF7L1-binding sites near repressed or induced genes with the percentage near random genes. The χ2 test was used to compare the percentage of PPARγ-binding sites near repressed or induced genes with the percentage near random genes. ***P < 0.001; *P < 0.05. For A and D, 20 TCF7L1-binding sites and five negative control sites were interrogated. Each point represents the percent input of one site. The lines represent mean ± SEM for TCF7L1 or control sites in each cell population, *** P < 0.001.
Fig. 2.
Fig. 2.
TCF7L1 depletion abrogates adipogenesis. (A) Reduced lipid accumulation. ORO staining (Upper) and phase-contrast microscopy (Lower) of siControl, siTCF7L1 #1, and siTCF7L1 #2 3T3-L1 electroporated cells differentiated for 7 d. (B) Reduced adipocyte protein expression. TCF7L1 and RAN protein levels in preadipocytes before DMI treatment (Upper) and PPARγ, FABP4, and RAN protein levels in day 7 adipocytes (Lower). (C) Reduced expression of adipocyte genes. siControl, siTCF7L1 #1, and siTCF7L1 #2 cells at day 7. (D) Increased expression of preadipocyte genes. siControl, siTCF7L1 #1, and siTCF7L1 #2 cells at day 7. Graphed values represent mean ± SEM (n = 3). *P < 0.05; **P < 0.01; ***P < 0.001.
Fig. 3.
Fig. 3.
TCF7L1 indirectly regulates PPARγ enhancer in early adipogenesis. (A) TCF7L1 depletion prevents PPARγ2 induction. PPARγ2 mRNA levels in siControl and siTCF7L1 3T3-L1 cells at 0 h and 24 h after DMI addition. (B) Ectopic PPARγ2 rescues adipogenic defects in TCF7L1-depleted cells. ORO (Upper) and phase-contrast microscopy (Lower) at 7 d after the addition of adipogenic stimuli to 3T3-L1 preadipocytes infected with Empty or PPARγ2 virus and electroporated with siTCF7L1 or siControl. (C) Ectopic PPARγ2 rescues adipocyte-specific protein expression in TCF7L1-depleted cells. TCF7L1, PPARγ, and RAN protein levels in 3T3-L1 cells before DMI treatment (Upper) and PPARγ, FABP4, and RAN protein levels at 7 d after adipogenic stimuli (Lower). (D) TCF7L1 depletion decreases PPARγ2 gene enhancer accessibility. FAIRE-qPCR at the 36b4 and PPARγ2 −182-kb enhancer in siControl and siTCF7L1 3T3-L1 cells treated for 24 h with DMI. (E) TCF7L1 depletion increases levels of cell structure–related genes that neighbor TCF7L1-binding sites, but not Dlk1, which lacks TCF7L1-binding sites. Col1α2, Dcn, Dlk1, Dpt, Ptn, Tes, Thbs1, Thbs2, and Tiam2 mRNA levels in siControl and siTCF7L1 3T3-L1 cells were treated for 24 h with DMI. In A, D, and E, graphed values represent mean ± SEM (n = 3). *P < 0.05; **P < 0.01; ***P < 0.001.
Fig. 4.
Fig. 4.
Myosin inhibition rescues TCF7L1-depleted cells. (A) TCF7L1-depleted cells display an increase in myosin fiber formation. Myosin IIa immunofluorescence in siControl and siTCF7L1 3T3-L1 cells treated with DMI for 24 h. Nuclei are counterstained with DAPI. (Scale bar: 20 μm.) Graphed values represent mean ± SEM (n = 3). *P < 0.05; **P < 0.01; ***P < 0.001. (B) Inhibition of myosin contraction rescues PPARγ2 expression in TCF7L1-depleted preadipocytes. PPARγ2 expression levels in siControl and siTCF7L1 3T3-L1 cells were treated for 24 h with DMI and DMSO or 50 μM blebbistatin. The one-tailed Student t test was used to determine significance. (C) Increased lipid accumulation in blebbistatin-treated, TCF7L1-depleted cells. ORO (Upper) and phase-contrast microscopy (Lower) at 7 d after addition of adipogenic stimuli to 3T3-L1 preadipocytes electroporated with siTCF7L1 or siControl. During the first 4 d of the differentiation protocol, cells were treated with DMSO or 50 μM blebbistatin as indicated.
Fig. 5.
Fig. 5.
TCF7L1 promotes adipogenesis in preconfluent cells. (A) TCF7L1 during adipogenesis. TCF7L1, PPARγ, FABP4, and RAN protein levels during 3T3-L1 adipogenesis after addition of DMI at day 0. (B) TCF7L1 is induced by the confluency of preadipocytes. TCF7L1, TCF7L2, and RAN protein levels in preconfluent and confluent 3T3-L1 preadipocytes, 3T3-F442A preadipocytes, and primary MEFs. (C) TCF7L1 induction by confluency is calcium-dependent. TCF7L1 and RAN protein levels in confluent 3T3-L1 preadipocytes were cultured in the presence of 2 mM EGTA, 2 mM CaCl2, or 2 mM MgCl2 for 16 h. (D) TCF7L1 induction is cadherin-dependent. Confluent preadipocytes were treated for 3 d with vehicle (H2O), 500 μg/mL of control cyclic peptide, or 500 μg/mL of pan type 1 cadherin blocking cyclic peptide. (E) Increased lipid accumulation. Phase-contrast microscopy of preconfluent preadipocytes infected with empty or TCF7L1 virus before addition of DMI (Left). ORO (Center) and phase-contrast (Right) microscopy of same cells 7 d after addition of adipogenic stimuli. (F) Increased adipocyte protein expression. TCF7L1 and RAN protein levels in preconfluent and confluent preadipocytes before DMI treatment (Upper) and PPARγ, FABP4, and RAN protein levels at 7 d after addition of adipogenic stimuli (Lower).
Fig. 6.
Fig. 6.
TCF7L1 confers adipogenic competency to NIH 3T3 cells. (A) TCF7L1 is not induced by confluency of non-adipogenic NIH 3T3 cells. TCF7L1 and RAN protein levels in confluent 3T3-L1 cells and preconfluent, confluent, and DMI plus rosiglitazone (TZD) treated NIH 3T3 cells. (B) Adipogenesis of NIH 3T3 cells expressing TCF7L1. ORO (Upper) and phase-contrast microscopy (Lower) of NIH 3T3 cells infected with Empty or TCF7L1 virus 7 d after addition of adipogenic stimuli. (C) Adipocyte protein expression in NIH 3T3 cells expressing TCF7L1. TCF7L1 and RAN protein levels in NIH 3T3 cells before DMI plus TZD treatment (Upper) and PPARγ, FABP4, and RAN protein levels at 7 d after adipogenic stimuli (Lower). (D) Increased adipocyte gene expression in NIH 3T3 cells expressing TCF7L1. (E) Decreased preadipocyte gene expression in NIH 3T3 cells expressing TCF7L1. (F) TCF7L1 promotes PPARγ2 expression in NIH 3T3 cells. Empty and TCF7L1 virus-infected NIH 3T3 cells at 0 h and 24 h after DMI plus TZD addition. (G) TCF7L1 promotes PPARγ2 gene enhancer accessibility in NIH 3T3 cells. Empty and TCF7L1 NIH 3T3 cells treated for 24 h with DMI plus TZD. (H) Zfp423 expression levels. 3T3-L1 preadipocytes and NIH 3T3 cells infected with TCF7L1 or empty virus, For D–H, graphed values represent mean ± SEM (n = 3). **P < 0.01; **P < 0.01; ***P < 0.001. ns, not significant.

References

    1. Galic S, Oakhill JS, Steinberg GR. Adipose tissue as an endocrine organ. Mol Cell Endocrinol. 2010;316:129–139. - PubMed
    1. Savage DB, Petersen KF, Shulman GI. Disordered lipid metabolism and the pathogenesis of insulin resistance. Physiol Rev. 2007;87:507–520. - PMC - PubMed
    1. Sun N, et al. Feeder-free derivation of induced pluripotent stem cells from adult human adipose stem cells. Proc Natl Acad Sci USA. 2009;106:15720–15725. - PMC - PubMed
    1. Sugii S, et al. Human and mouse adipose-derived cells support feeder-independent induction of pluripotent stem cells. Proc Natl Acad Sci USA. 2010;107:3558–3563. - PMC - PubMed
    1. Tran TT, Yamamoto Y, Gesta S, Kahn CR. Beneficial effects of subcutaneous fat transplantation on metabolism. Cell Metab. 2008;7:410–420. - PMC - PubMed

Publication types

Substances

Associated data