. 2011 Sep 13;30(22):4628-41.
doi: 10.1038/emboj.2011.331.

microRNA-101 is a potent inhibitor of autophagy

Affiliations

microRNA-101 is a potent inhibitor of autophagy

Lisa B Frankel et al. EMBO J. .

Abstract

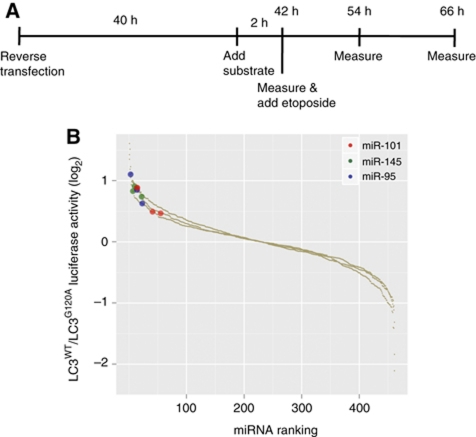
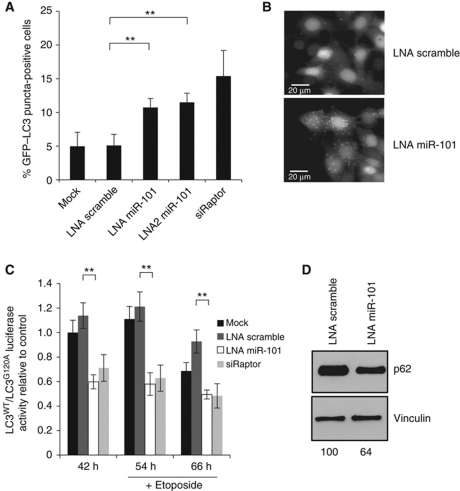
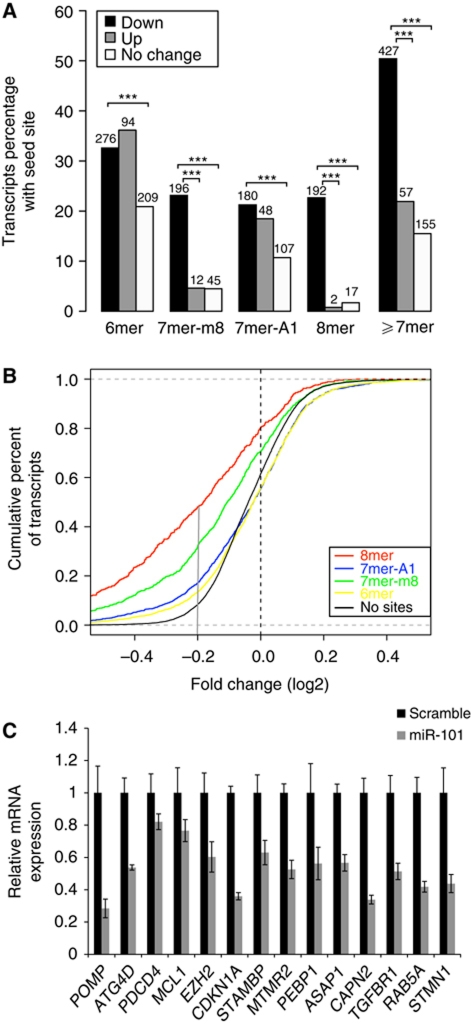
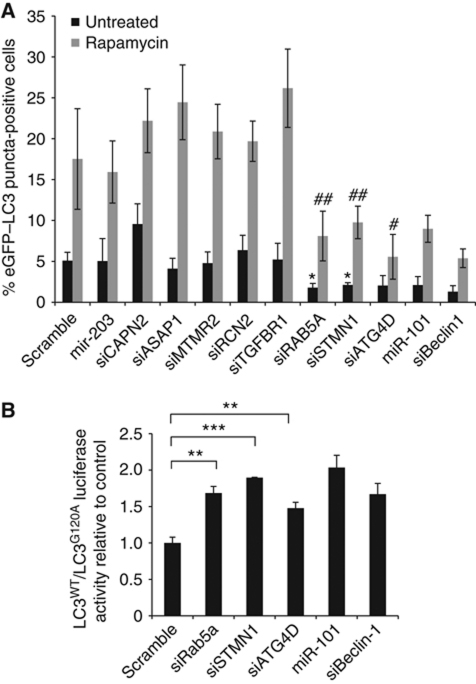
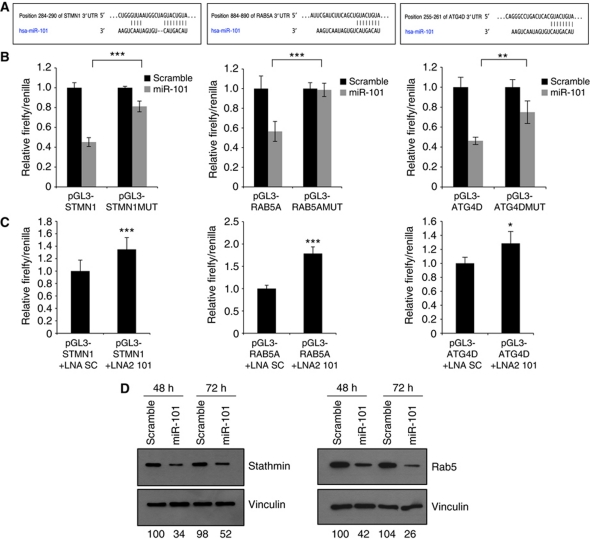
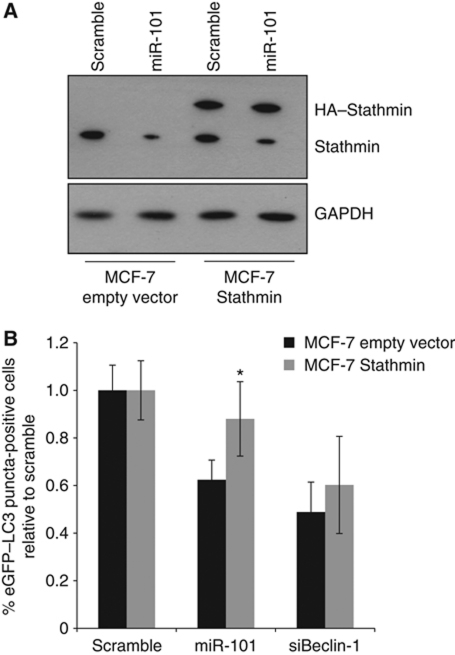
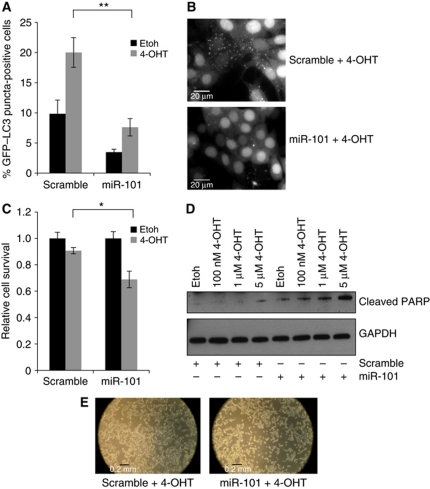
Autophagy is an evolutionarily conserved mechanism of cellular self-digestion in which proteins and organelles are degraded through delivery to lysosomes. Defects in this process are implicated in numerous human diseases including cancer. To further elucidate regulatory mechanisms of autophagy, we performed a functional screen in search of microRNAs (miRNAs), which regulate the autophagic flux in breast cancer cells. In this study, we identified the tumour suppressive miRNA, miR-101, as a potent inhibitor of basal, etoposide- and rapamycin-induced autophagy. Through transcriptome profiling, we identified three novel miR-101 targets, STMN1, RAB5A and ATG4D. siRNA-mediated depletion of these genes phenocopied the effect of miR-101 overexpression, demonstrating their importance in autophagy regulation. Importantly, overexpression of STMN1 could partially rescue cells from miR-101-mediated inhibition of autophagy, indicating a functional importance for this target. Finally, we show that miR-101-mediated inhibition of autophagy can sensitize breast cancer cells to 4-hydroxytamoxifen (4-OHT)-mediated cell death. Collectively, these data establish a novel link between two highly important and rapidly growing research fields and present a new role for miR-101 as a key regulator of autophagy.


Conflict of interest statement

The authors declare that they have no conflict of interest.

Figures

Figure 1
Figure 1
Screening approach for identification of miRNAs regulating autophagic flux in MCF-7 cells. (A) Outline of the timeline used for the screening assay. (B) Combined results from three independent screens, 66 h after transfection. MCF-7 RLuc–LC3WT and RLuc–LC3G120A were reverse transfected with the Ambion Pre-miR Library in three independent screens (see Materials and methods for details). The miRNAs were ranked according to log2 LC3WT/LC3G120A luciferase activity values (y axis). Highlighted in red, green and blue are three miRNAs, which consistently inhibited autophagic flux in the three independent screens (miR-145 P=0.0033, miR-95 P=0.0033 and miR-101 P=0.0305).
Figure 2
Figure 2
miR-101 overexpression inhibits autophagy. (A) miR-101 overexpression inhibits eGFP–LC3 translocation. MCF-7 eGFP–LC3 cells were transfected with indicated miRNAs or siRNAs and fixed 72 h post-transfection. Percentage of eGFP–LC3 puncta-positive cells was quantified by automated image acquisition and analysis using a threshold of >5 dots/cell. Data are shown as the mean±s.d. of five replicates and is representative of three independent experiments. *P<0.05, **P<0.005. (B) Representative images from the quantification shown in (A). Scale bars represent 20 μM. (C) miR-101 overexpression inhibits autophagic flux. MCF-7 RLuc–LC3WT and RLuc–LC3G120A cells were reverse transfected with indicated miRNAs or siRNAs and 42 h later 50 μM etoposide was added. Luciferase activity was measured at 42, 54 and 66 h after transfection. Data are shown as the mean±s.d. of three replicates and are representative of three independent experiments. *P<0.05, **P<0.005. (D) miR-101 overexpression leads to accumulation of p62 protein. Western blot analysis 72 h after transfection with miR-101 or scramble control. p62 bands were quantified relative to the vinculin loading control using ImageJ software and the relative quantifications are shown. The data are representative of three independent experiments.
Figure 3
Figure 3
Knockdown of endogenous miR-101 induces autophagy. (A) miR-101 inhibition induces eGFP–LC3 translocation. MCF-7 eGFP–LC3 cells were transfected with indicated LNAs or siRNAs and fixed 72 h post-transfection. Percentage of eGFP–LC3 puncta-positive cells was quantified using a threshold of >5 dots per cell. Data are shown as the mean±s.d. of five replicates and are representative of three independent experiments. **P<0.005. (B) Representative images from the quantification shown in (A). Scale bars represent 20 μM. (C) miR-101 inhibition induces autophagic flux. MCF-7 RLuc–LC3WT and RLuc–LC3G120A cells were reverse transfected with indicated LNAs or siRNAs and 42 h later 50 μM etoposide was added. Luciferase activity was measured at 42, 54 and 66 h after transfection. Data are shown as the mean±s.d. of three replicates and are representative of three independent experiments. **P<0.005. (D) miR-101 inhibition leads to decreased p62 expression. Western blot analysis 72 h after transfection with LNA miR-101 or LNA scramble. p62 bands were quantified relative to the vinculin loading control using ImageJ software and the relative quantifications are shown. The data are representative of three independent experiments.
Figure 4
Figure 4
Identification of miR-101 targets by microarray analysis after miR-101 overexpression. (A) Seed site enrichment. The proportion and actual number of transcripts in the up, down and no change sets with different seeds types are shown. The seed types are mutually exclusive (see Materials and methods). Enrichment significance is labelled as ***P<0.0005 for down set versus up set and down set versus no change set. ‘⩾7mer’ includes 8mer, 7mer-m8 and 7mer-A1 sites. P-values for ⩾7mer seed site enrichment were 1.4e−16 (down versus up) and 1.9e−59 (down versus no change). (B) Different seed match types affect the level of transcript downregulation. Cumulative distribution functions for fold changes (log2FC) of transcripts containing different seed types or no seed sites for miR-101. X axis is log2FC from high downregulation to no change (log2FC=0) and from no change to high upregulation and y axis is the fraction of transcripts smaller than or equal to a certain fold change. For example, the solid grey vertical line drawn at log2FC=−0.2 approximately corresponds to 45% of transcripts containing 8mer seed type that were downregulated at least log2FC −0.2, compared with only 10% of transcripts containing 6mer seed type. (C) qPCR validation of 14 downregulated transcripts from an independent transfection experiment. For each transcript, the values are normalized relative to the scramble control sample and to the housekeeping gene. The error bars represent ±s.d. of three replicates.
Figure 5
Figure 5
siRNAs against STMN1, RAB5A and ATG4D inhibit basal and rapamycin-induced autophagy. (A) siRNA knockdown of a panel of genes selected from the array analysis led to identification of STMN1, RAB5A and ATG4D as potentially interesting miR-101 target candidates. MCF-7 eGFP–LC3 cells were transfected with indicated miRNAs or siRNAs and fixed 72 h post-transfection. Two hours prior to fixation, cells were treated with 200 nM rapamycin or left untreated. Percentage of eGFP–LC3 puncta-positive cells was quantified as described previously. Data are shown as the mean±s.d. of five replicates and are representative of two or three independent experiments. *P<0.05 relative to miR-203 untreated, #P<0.05 relative to miR-203 rapamycin, ##P<0.005 relative to miR-203 rapamycin. (B) Knockdown of STMN1, RAB5A and ATG4D decreases autophagic flux. MCF-7 RLuc–LC3WT and RLuc–LC3G120A cells were reverse transfected with indicated miRNAs or siRNAs and 42 h later luciferase activity was measured. Data are shown as the mean±s.d. of three replicates and are representative of at least three independent experiments. **P<0.005, ***P<0.0005.
Figure 6
Figure 6
miR-101 directly targets STMN1, RAB5A and ATG4D. (A) Predicted binding between miR-101 and the 8mer seed matches in STMN1, RAB5A and ATG4D 3′UTRs. (B, C) miR-101 regulates STMN1, RAB5A and ATG4D 3′UTR reporters. Luciferase reporter assays 24 h after transfection with indicated pGL3 firefly plasmids and a renilla transfection control plasmid, co-transfected with miR-101, LNA miR-101 or relevant scramble controls. Data shown are the mean±s.d. of four replicates and are representative of two or three independent experiments. *P<0.05, **P<0.005, ***P<0.0005. (D) miR-101 decreases Stathmin and RAB5A protein levels. Western blot analysis 48 or 72 h after transfection with miR-101 or scramble control. The Stathmin and RAB5 bands were quantified relative to the vinculin loading control using ImageJ software and the relative quantifications are shown. The data are representative of three independent experiments.
Figure 7
Figure 7
Transmission electron microscopy confirms repression of autophagy by miR-101 overexpression or Stathmin knockdown. (AC) Representative images of MCF-7 cells transfected for 72 h as indicated, and treated for 2 h with 200 nM rapamycin prior to fixation. Top panel: overview images (× 3400 magnification). Scale bars represent 5 μM. Bottom panel: close-up images (× 24 500 magnification) of cytoplasmic regions containing autophagosomes (denoted by white arrowheads). Scale bars represent 1 μM. (D) The data were quantified by counting the number of autophagosomes per cross-sectioned cell (scramble n=30, miR-101 n=25, siStathmin n=25). ***P<0.0005.
Figure 8
Figure 8
Stathmin is an important functional target of miR-101 in autophagy. (A) MCF-7-Stathmin cells stably express a 3′UTR-less HA–Stathmin, which is resistant to miR-101-mediated regulation. Cells were analysed by western blotting 72 h after transfection for levels of HA–Stathmin (upper band) or endogenous Stathmin (lower band). GAPDH was used as a loading control. (B) MCF-7-Stathmin cells are less sensitive to miR-101-mediated inhibition eGFP–LC3 translocation. MCF-7-Stathmin or MCF-7 empty vector control cells were transfected as indicated, fixed 72 h post-transfection and the percentage of eGFP–LC3 puncta-positive cells was quantified as described previously. The data are shown as the mean±s.e.m. of four pooled experiments, each with five replicates and are plotted relative to the Scramble control. *P<0.05 for miR-101 MCF-7-Stathmin versus miR-101 MCF-7 empty vector.
Figure 9
Figure 9
miR-101-mediated inhibition of autophagy increases 4-OHT-induced cell death. (A) miR-101 decreases 4-OHT-mediated eGFP–LC3 translocation. MCF-7 eGFP–LC3 cells were transfected with miR-101 or a scramble control and the following day cells were treated with 1 μM 4-OHT or EtOH vehicle control. After 3 days of treatment, the percentage of eGFP–LC3 puncta-positive cells was quantified using a threshold of >5 dots per cell. Data shown is the mean±s.d. of five replicates and are representative of three independent experiments. **P<0.005. (B) Representative images from the quantification in (A). Scale bars represent 20 μM. (C) Combined miR-101 and 4-OHT reduces cell viability. Cells were transfected and treated as described in (A) and cellular viability was determined using the MTT assay. The data are normalized to the EtOH control and show the mean ±s.d. of three replicates, representative of three independent experiments. *P<0.05. (D) Combined miR-101 and 4-OHT increases PARP cleavage. Cells were transfected and treated as described in (A) (with indicated 4-OHT concentrations) and analysed by western blotting 72 h after transfection to assess the amount of 85 kDa PARP cleavage fragment. The data are representative of two independent experiments. (E) Phase contrast microscopy images from cells treated as described in (A).

Comment in

References

    1. Abedin MJ, Wang D, McDonnell MA, Lehmann U, Kelekar A (2007) Autophagy delays apoptotic death in breast cancer cells following DNA damage. Cell Death Differ 14: 500–510 - PubMed
    1. Alexa A, Rahnenfuhrer J, Lengauer T (2006) Improved scoring of functional groups from gene expression data by decorrelating GO graph structure. Bioinformatics 22: 1600–1607 - PubMed
    1. Alli E, Yang JM, Ford JM, Hait WN (2007a) Reversal of stathmin-mediated resistance to paclitaxel and vinblastine in human breast carcinoma cells. Mol Pharmacol 71: 1233–1240 - PubMed
    1. Alli E, Yang JM, Hait WN (2007b) Silencing of stathmin induces tumor-suppressor function in breast cancer cell lines harboring mutant p53. Oncogene 26: 1003–1012 - PubMed
    1. Amaravadi RK, Yu D, Lum JJ, Bui T, Christophorou MA, Evan GI, Thomas-Tikhonenko A, Thompson CB (2007) Autophagy inhibition enhances therapy-induced apoptosis in a Myc-induced model of lymphoma. J Clin Invest 117: 326–336 - PMC - PubMed

Publication types

MeSH terms