. 2011 Sep 13:7:529.
doi: 10.1038/msb.2011.62.

Coupled pre-mRNA and mRNA dynamics unveil operational strategies underlying transcriptional responses to stimuli

Affiliations

Coupled pre-mRNA and mRNA dynamics unveil operational strategies underlying transcriptional responses to stimuli

Amit Zeisel et al. Mol Syst Biol. .

Abstract

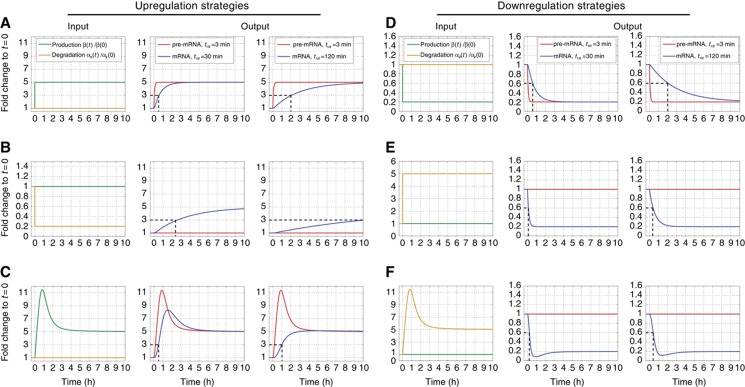
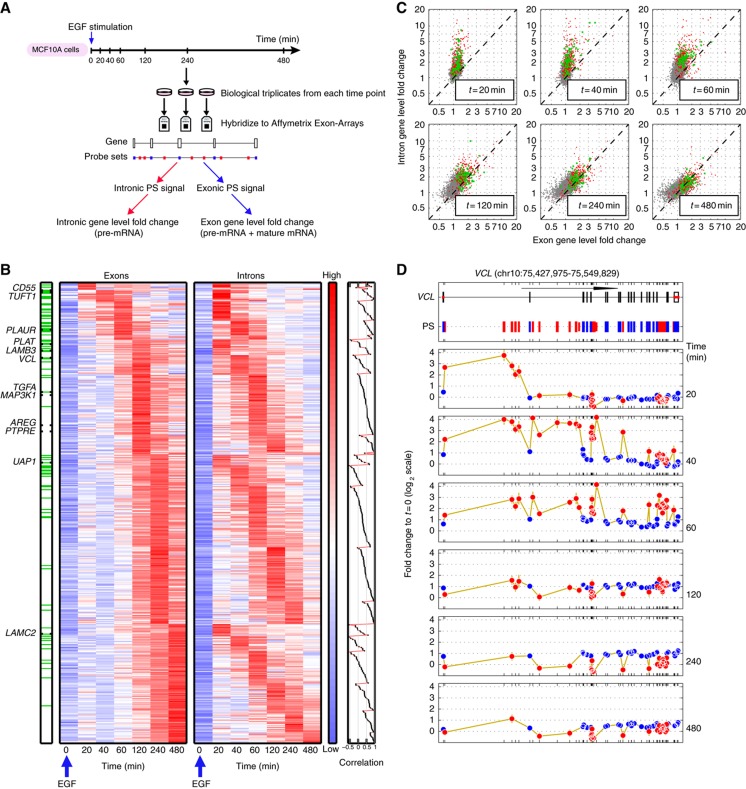
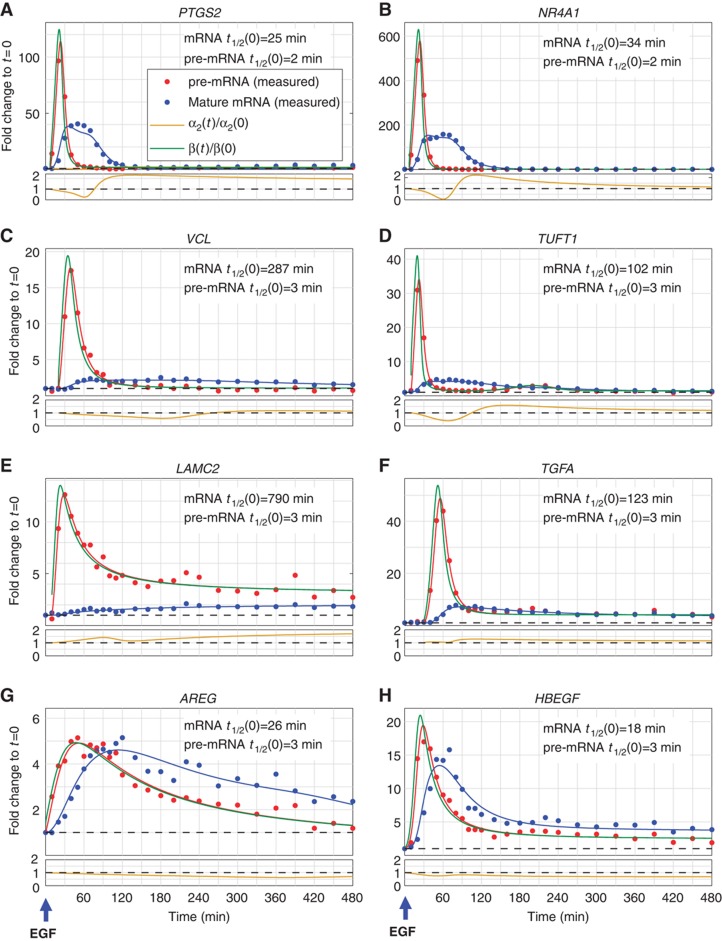
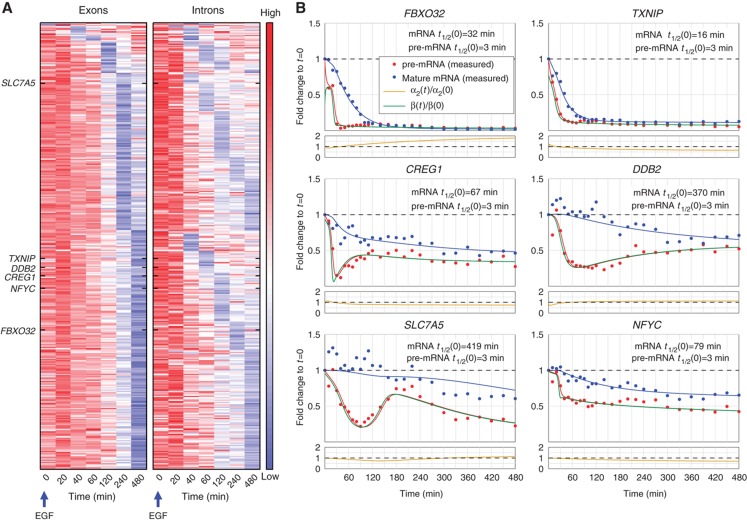
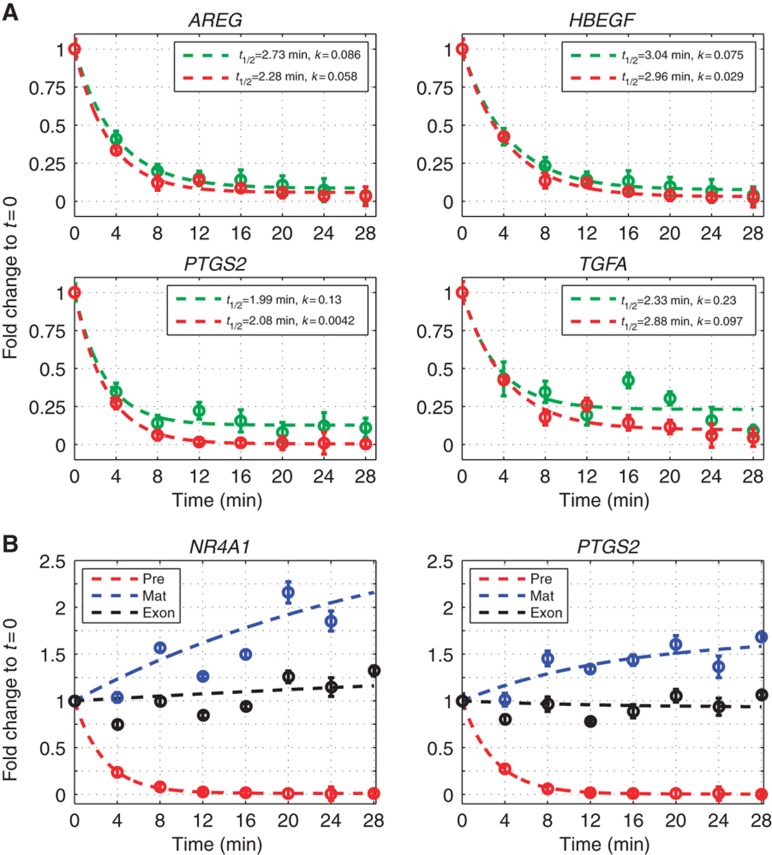
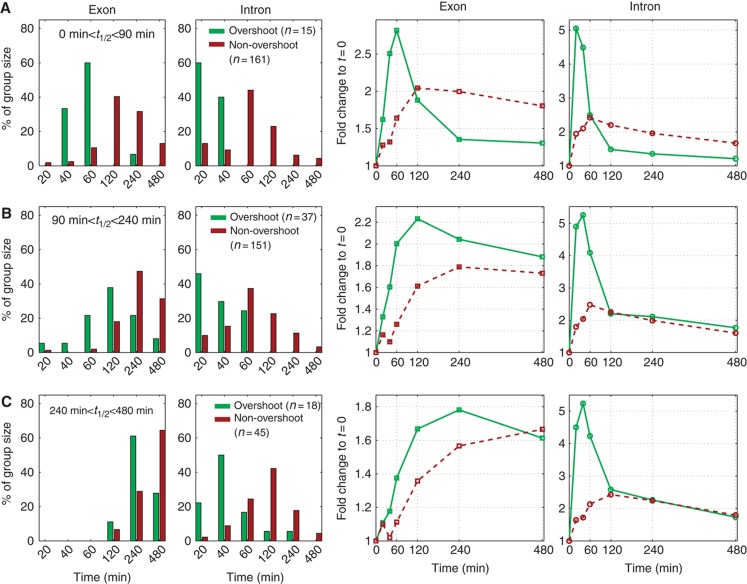
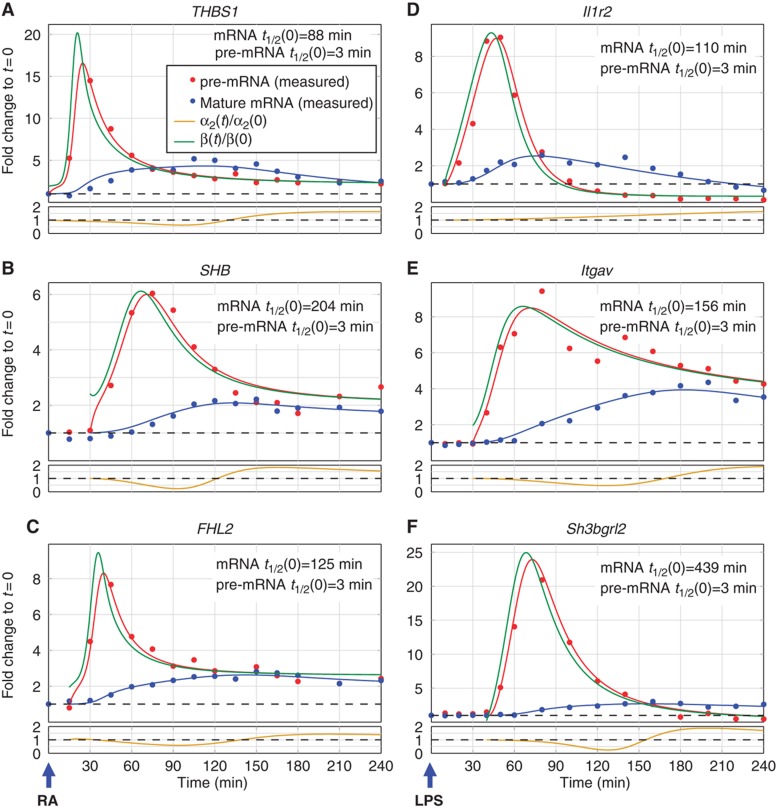
Transcriptional responses to extracellular stimuli involve tuning the rates of transcript production and degradation. Here, we show that the time-dependent profiles of these rates can be inferred from simultaneous measurements of precursor mRNA (pre-mRNA) and mature mRNA profiles. Transcriptome-wide measurements demonstrate that genes with similar mRNA profiles often exhibit marked differences in the amplitude and onset of their production rate. The latter is characterized by a large dynamic range, with a group of genes exhibiting an unexpectedly strong transient production overshoot, thereby accelerating their induction and, when combined with time-dependent degradation, shaping transient responses with precise timing and amplitude.


Conflict of interest statement

The authors declare that they have no conflict of interest.

Figures

Figure 1
Figure 1
Pre-mRNA and mRNA response profiles for stimulus-induced production and degradation changes. Different time-dependent production rates (green) and degradation coefficients (gold) are shown in the left column. Resulting pre-mRNA (red) and mRNA (blue) profiles, obtained by numerically solving Equations (4) and (5), are presented for mRNAs with initial half-lives of 30 and 120 min in the middle and right columns, respectively. All strategies yield a 5-fold change in the steady-state mRNA level, pre-mRNA profiles closely mimic production, while mRNA FC profiles are delayed and may be qualitatively different. (A) Five-fold step increase of production rate at time t=0. A rapid increase of pre-mRNA levels is followed by slower mRNA response. Dashed black line indicates the rise time to half of the aimed level, determined by the mRNA half-life. (B) Signal-induced 5-fold step decrease of degradation rate. Pre-mRNA levels reflect unchanged production; mRNA accumulates now more slowly compared with (A). (C) Signal-induced transient overshoot in production rate accelerates mRNA induction, particularly for mRNAs with long initial half-lives. (D) Five-fold step decrease in production rate at t=0. (E) Degradation driven downregulation: response time is shorter due to reduction of the mRNA half-life. (F) A transient overshoot in degradation accelerates response time of downregulated genes.
Figure 2
Figure 2
EGF induces distinct transcriptional dynamics of pre-mRNAs and mRNAs in MCF10A cells. (A) Experimental outline: MCF10A mammary epithelial cells were stimulated with EGF for the indicated intervals and RNA was hybridized to Affymetrix Exon Arrays. Annotation and signal intensity-based filtering was performed to define probe sets (PS) interrogating exons (blue marks) and introns (red). Fold changes (FCs) of intronic and exonic PS were weighed separately to define the pre-mRNA and mRNA FC for each gene. (B) Pre-mRNA and mRNA profiles of 441 transcriptionally induced genes. The left (right) heatmap displays mRNA (pre-mRNA) expression, as defined by the gene-level exon (intron) FC profiles; genes are grouped according to the peak time of their mRNA expression and within each such group ordered according to the peak time of their pre-mRNA FC. Finally, within each subgroup the transcripts were ordered according to the correlation between the pre-mRNA and mRNA profiles (rightmost panel). The order of genes is the same in both heatmaps. Note that the log-transformed expression values of each row were centered and normalized (separately for pre-mRNA and mRNA, owing to their different dynamic range). Hence, the log-FC values at t=0 are not uniformly 0. Green lines on the bar on the left indicate genes with production overshoot (i.e., the maximal FC of intronic PS exceeded that of exonic PS by >2-fold). Genes chosen for detailed validation (Figure 3) are indicated. (C) Scatter plots comparing gene-level intron (pre-mRNA) and exon (mRNA) FC during EGF stimulation. Genes with mRNA FC⩽1.5 over the whole time course (grey dots), transcriptionally induced genes with production overshoot (green dots) or without (red dots) are shown. Note the similarity of mRNA FC of overshooting and non-overshooting genes. (D) Space-time description of probe-level FC of an overshooting gene. Upper panel: Genomic organization of the vinculin (VCL) gene (122 kb). Arrow length corresponds to 50 kb. Positions of exonic (blue) and intronic (red) PS are indicated. Lower panels: FC (log2 scale) of each PS with respect to its baseline value is shown for the time course outlined in (A). Only PS with present calls in all replicates of the respective time points compared are shown. Error bars (in gold) represent standard deviations. Note that intronic and exonic PS display different behavior and dynamic range.
Figure 3
Figure 3
Genes with distinct mRNA expression profiles exhibit production overshoot. Real-time quantitative PCR (qPCR) measurements of expression FC profiles of selected genes with production overshoot (AF) or no production overshoot (G, H), in a high-resolution time course following stimulation of MCF10A cells with EGF. Dots represent averages of technical triplicates, solid lines represent best fit (see Supplementary information) of pre-mRNA (red) and mature mRNA (blue). Production profiles (green lines) and degradation (gold) were inferred from these measurements. Half-lives (t1/2) of pre-mRNAs were measured as described in the text, whereas those of mRNA were estimated from fit to the data (see Materials and methods).
Figure 4
Figure 4
EGF driven downregulation of pre-mRNAs and mRNAs in MCF10A cells. (A) Pre-mRNA and mRNA profiles of 364 transcriptionally repressed genes. The left heatmap displays mRNA expression as defined by the gene-level exon FC profiles; genes are grouped first according to the time of their lowest mRNA FC, and within each such group, they are ordered according to the time of their lowest pre-mRNA FC, as reflected by intronic FC (right heatmap). The order of the genes is the same in both heatmaps. Names of genes that were chosen for detailed validation are indicated. Note that mRNA profiles are very poor indicators of shutdown of pre-mRNA production. Heatmaps were normalized as in Figure 2B. (B) qPCR measurements of expression FC profiles of selected downregulated genes in a high-resolution time course following stimulation of MCF10A cells with EGF. Dots represent averages of technical triplicates, solid lines represent best fit (see Materials and methods) of pre-mRNA (red) and mature mRNA (blue). Production profiles (green lines), mRNA half-lives and degradation (gold) were inferred from these measurements as described in Materials and methods.
Figure 5
Figure 5
Validation of model assumptions. (A) Pre-mRNA decay in unstimulated (green curves) and EGF-stimulated (red curves) MCF10A cells: transcription was arrested by applying ActD (10 μM) to mock-stimulated MCF10A cells or to cells near the peak of pre-mRNA induction after pre-incubation with EGF (20 ng/ml) for 20 min (AREG, HBEGF, PTGS2) or 40 min (TGFA), respectively. RNA was isolated at the indicated time points and qPCR was used to measure pre-mRNA decay. Note that the pre-mRNA conversion coefficient is unaffected by EGF stimulation. (B) Dynamics of pre-, exon and mature mRNA after transcription arrest at the peak of pre-mRNA induction: MCF10A cells were stimulated with EGF for 20 min before applying ActD as described in (A). Pre-mRNA (red), exonic (black) and mature mRNA (blue) were measured by qPCR. Note that pre-mRNA outflux is predominantly determined by conversion to mRNA. All symbols and error bars denote mean values and standard deviations of technical triplicates from one out of three independently repeated experiments. RNA half-lives (t1/2) and asymptotic constants (k) were calculated and curves were fit as described in Materials and methods.
Figure 6
Figure 6
Pre-mRNA production overshoot accelerates the response time of mRNAs. Genes that were transcriptionally induced by EGF stimulation of MCF10A cells (as described in legend to Figure 2) were grouped according to their mRNA half-lives (extracted from our measured expression profiles, as described in Materials and methods). Results are shown for three representative groups with half-lives between (A) 0–90 min (B) 90–240 min and (C) 240–480 min, respectively. The two columns on the left depict the percentage of genes, whose exons and introns peaked at the indicated time points, green for overshooting and brown for non-overshooting genes. The two columns on the right present the mean temporal expression FC profiles for exons and introns, for the overshooting (green) and non-overshooting (brown) genes. Note that within each group of genes with similar half-lives we observe earlier mRNA peak times for the genes with pre-mRNA production overshoot.
Figure 7
Figure 7
Pre-mRNA production overshoot is a general operational strategy in mammalian transcriptional networks. The plots in (AF) show qPCR measurements of pre-mRNA (red) and mature mRNA (blue) expression profiles for selected genes exhibiting production overshoot. Dots represent averages of technical triplicate measurements and solid lines represent best fit (see Supplementary information). Production and degradation profiles were inferred from these measurements as described in Materials and methods, and their time-dependent profiles are indicated by green and gold curves, respectively. (A–C) Production overshoot in retinoic acid (RA)-stimulated human embryonic stem cells. (D–F) Production overshoot in lipopolysaccharide (LPS)-stimulated primary murine dendritic cells.

References

    1. Alon U (2007) An Introduction to Systems Biology—Designs Principles of Biological Circuits. Boca Raton, FL: Chapman and Hall/CRC
    1. Amit I, Citri A, Shay T, Lu Y, Katz M, Zhang F, Tarcic G, Siwak D, Lahad J, Jacob-Hirsch J, Amariglio N, Vaisman N, Segal E, Rechavi G, Alon U, Mills GB, Domany E, Yarden Y (2007) A module of negative feedback regulators defines growth factor signaling. Nat Genet 39: 503–512 - PubMed
    1. Amit I, Garber M, Chevrier N, Leite AP, Donner Y, Eisenhaure T, Guttman M, Grenier JK, Li W, Zuk O, Schubert LA, Birditt B, Shay T, Goren A, Zhang X, Smith Z, Deering R, McDonald RC, Cabili M, Bernstein BE et al. (2009) Unbiased reconstruction of a mammalian transcriptional network mediating pathogen responses. Science 326: 257–263 - PMC - PubMed
    1. Avraham R, Sas-Chen A, Manor O, Steinfeld I, Shalgi R, Tarcic G, Bossel N, Zeisel A, Amit I, Zwang Y, Enerly E, Russnes HG, Biagioni F, Mottolese M, Strano S, Blandino G, Borresen-Dale AL, Pilpel Y, Yakhini Z, Segal E et al. (2010) EGF decreases the abundance of microRNAs that restrain oncogenic transcription factors. Sci Signal 3: ra43. - PubMed
    1. Barenco M, Brewer D, Papouli E, Tomescu D, Callard R, Stark J, Hubank M (2009) Dissection of a complex transcriptional response using genome-wide transcriptional modelling. Mol Syst Biol 5: 327. - PMC - PubMed

Publication types

MeSH terms