Clinical Trial
. 2011;6(9):e23379.
doi: 10.1371/journal.pone.0023379. Epub 2011 Sep 6.

Multicenter phase 2 trial of sirolimus for tuberous sclerosis: kidney angiomyolipomas and other tumors regress and VEGF- D levels decrease

Affiliations
Clinical Trial

Multicenter phase 2 trial of sirolimus for tuberous sclerosis: kidney angiomyolipomas and other tumors regress and VEGF- D levels decrease

Sandra L Dabora et al. PLoS One. 2011.

Abstract

Background: Tuberous sclerosis (TSC) related tumors are characterized by constitutively activated mTOR signaling due to mutations in TSC1 or TSC2.

Methods: We completed a phase 2 multicenter trial to evaluate the efficacy and tolerability of the mTOR inhibitor, sirolimus, for the treatment of kidney angiomyolipomas.

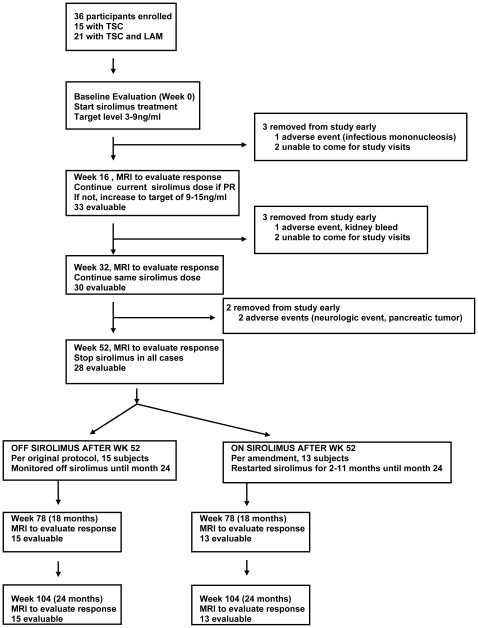
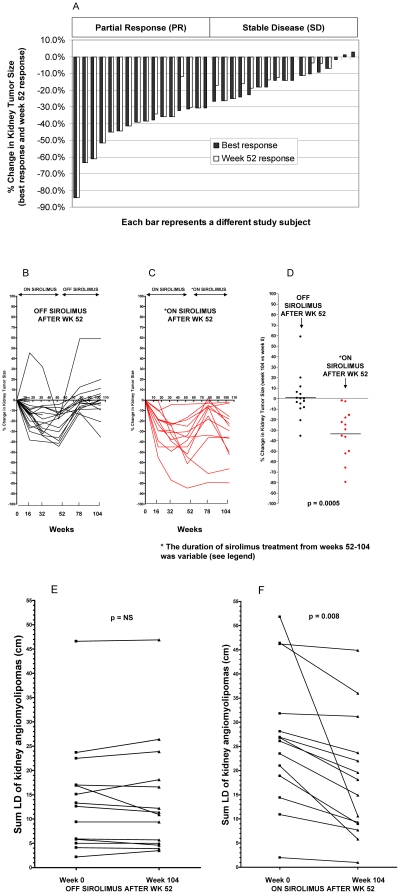
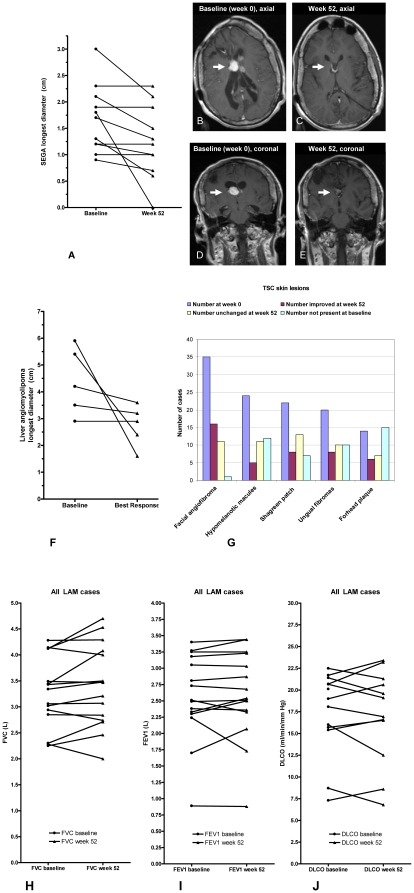
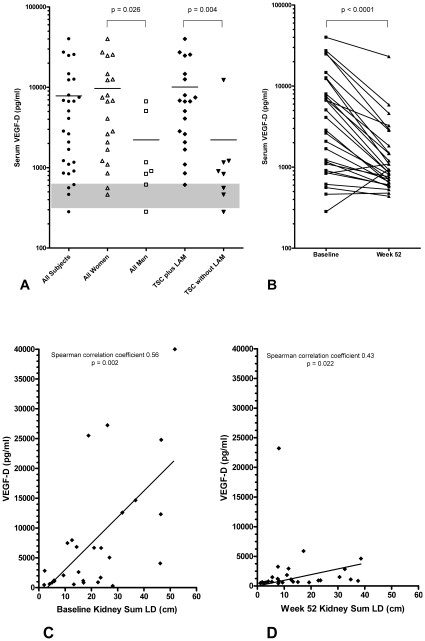
Results: 36 adults with TSC or TSC/LAM were enrolled and started on daily sirolimus. The overall response rate was 44.4% (95% confidence intervals [CI] 28 to 61); 16/36 had a partial response. The remainder had stable disease (47.2%, 17/36), or were unevaluable (8.3%, 3/36). The mean decrease in kidney tumor size (sum of the longest diameters [sum LD]) was 29.9% (95% CI, 22 to 37; n = 28 at week 52). Drug related grade 1-2 toxicities that occurred with a frequency of >20% included: stomatitis, hypertriglyceridemia, hypercholesterolemia, bone marrow suppression (anemia, mild neutropenia, leucopenia), proteinuria, and joint pain. There were three drug related grade 3 events: lymphopenia, headache, weight gain. Kidney angiomyolipomas regrew when sirolimus was discontinued but responses tended to persist if treatment was continued after week 52. We observed regression of brain tumors (SEGAs) in 7/11 cases (26% mean decrease in diameter), regression of liver angiomyolipomas in 4/5 cases (32.1% mean decrease in longest diameter), subjective improvement in facial angiofibromas in 57%, and stable lung function in women with TSC/LAM (n = 15). A correlative biomarker study showed that serum VEGF-D levels are elevated at baseline, decrease with sirolimus treatment, and correlate with kidney angiomyolipoma size (Spearman correlation coefficient 0.54, p = 0.001, at baseline).

Conclusions: Sirolimus treatment for 52 weeks induced regression of kidney angiomyolipomas, SEGAs, and liver angiomyolipomas. Serum VEGF-D may be a useful biomarker for monitoring kidney angiomyolipoma size. Future studies are needed to determine benefits and risks of longer duration treatment in adults and children with TSC.

Trial registration: Clinicaltrials.gov NCT00126672.


Conflict of interest statement

Competing Interests: Wyeth/Pfizer supplied study drug at no charge per an investigator originated proposal written by SD. SD has been a consultant to Novartis. There are no patents, products in development or marketed products to declare. This does not alter the authors' adherence to all the PLoS ONE policies on sharing data and materials.

Figures

Figure 1
Figure 1. Enrollment Chart.
Figure 2
Figure 2. Kidney angiomyolipoma regression with sirolimus treatment.
Panel A) percent change in kidney tumor size (sum LD) for individual cases (black bars-best response during year one on study; adjacent white bars-week 52 response for same subject). All subjects were treated with sirolimus from weeks 0 to 52. Panels B and C) percent change in kidney tumor size compared with baseline for kidney tumors at each time point. After week 52, a subset (Panel B) was observed off treatment (black, OFF SIROLIMUS AFTER WK 52 group, n = 15). Another subset (Panel C) received additional study drug treatment after week 52 (red, ON SIROLIMUS AFTER WK 52 group, n = 13). Panel D) percent change in kidney tumor size at 24 months (104 weeks) for indicated groups. Panel E) kidney tumor size at week 0 and week 104 (month 24) for the OFF SIROLIMUS AFTER WK 52 group. Panel F) kidney tumor size at week 0 and week 104 (month 24) for ON SIROLIMUS AFTER WK 52 group.
Figure 3
Figure 3. Brain tumors (SEGAs), liver angiomyolipomas, skin lesions, and lung function.
Panel A shows the diameter (cm) of brain tumors (SEGAs) at baseline and week 52 in 11 participants. T1 post gadolinium MR images (courtesy of Dr. Nathaniel D. Wycliffe, Department of Radiology, Loma Linda University School of Medicine) in panels B–E show a SEGA near the right foramen of Monroe that measured 1.8 cm maximal diameter at baseline (B,D) with near complete resolution of the lesion after sirolimus treatment (C,E).. Panel F is a graph of liver angiomyolipoma size for all cases (longest diameter in cm) at baseline and at best response. Panel G shows changes in TSC skin lesions with sirolimus treatment. Panels H–J show pulmonary function data (FVC, FEV1, DLCO) at week 0 and week 52 for female participants with TSC/LAM (n = 15). See Tables S6, S7 and Figures S5, S6, S7 for data on LAM subsets.
Figure 4
Figure 4. Serum VEGF-D levels are elevated at baseline, decrease with sirolimus treatment, and correlate with kidney angiomyolipoma size.
Panel A shows baseline serum VEGF-D levels for all subjects and indicated subgroups (women, men, TSC/LAM and TSC). According to other studies , , mean serum VEGF-D levels in control female populations are 300–657 ng/ml (indicated by gray box, see additional details in Table S4, mean VEGF-D levels in control males is not available). Panel B shows that serum VEGF-D levels decrease after 52 weeks of sirolimus treatment. Panels C and D show the correlation between kidney tumor size (sum LD in cm) and serum VEGF-D levels (pg/ml) at baseline (Panel C) and week 52 (Panel D).

References

    1. Crino PB, Nathanson KL, Henske EP. The tuberous sclerosis complex. N Engl J Med. 2006;355:1345–1356. - PubMed
    1. Roach ES, Gomez MR, Northrup H. Tuberous sclerosis complex consensus conference: revised clinical diagnostic criteria. J Child Neurol. 1998;13:624–628. - PubMed
    1. Henske EP, Wessner LL, Golden J, Scheithauer BW, Vortmeyer AO, et al. Loss of tuberin in both subependymal giant cell astrocytomas and angiomyolipomas supports a two-hit model for the pathogenesis of tuberous sclerosis tumors. Am J Pathol. 1997;151:1639–1647. - PMC - PubMed
    1. Nie D, Di Nardo A, Han JM, Baharanyi H, Kramvis I, et al. Tsc2-Rheb signaling regulates EphA-mediated axon guidance. Nat Neurosci. 2010;13:163–172. - PMC - PubMed
    1. Ehninger D, Han S, Shilyansky C, Zhou Y, Li W, et al. Reversal of learning deficits in a Tsc2+/− mouse model of tuberous sclerosis. Nat Med. 2008;14:843–848. - PMC - PubMed

Publication types

MeSH terms

Associated data