

Simulated increases in body fat and errors in bone mineral density measurements by DXA and QCT
- PMID: 21915902
- PMCID: PMC3864640
- DOI: 10.1002/jbmr.506
Simulated increases in body fat and errors in bone mineral density measurements by DXA and QCT
Abstract
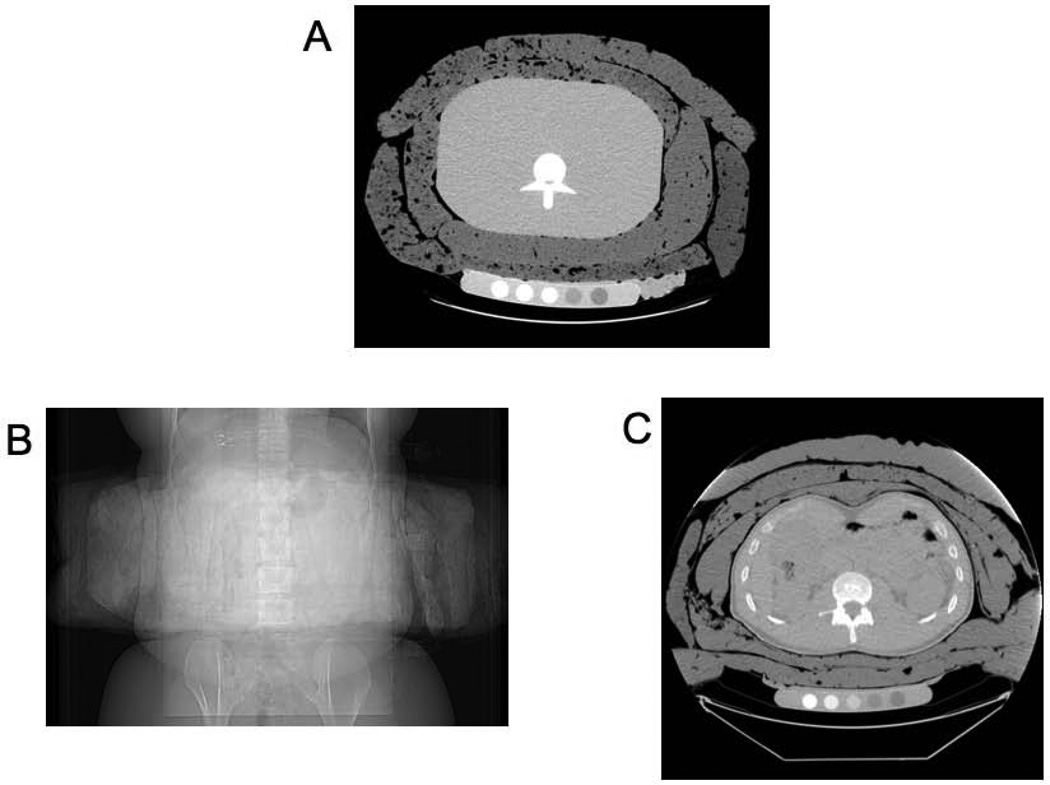
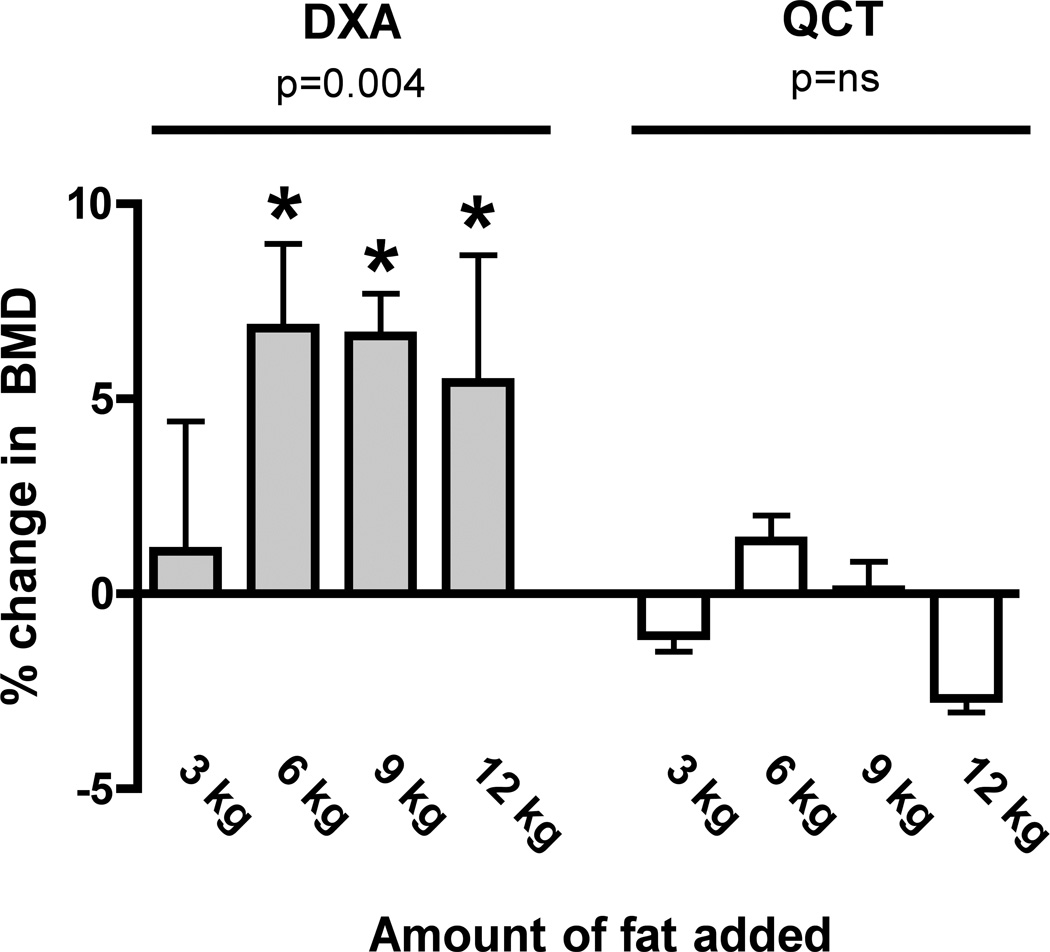
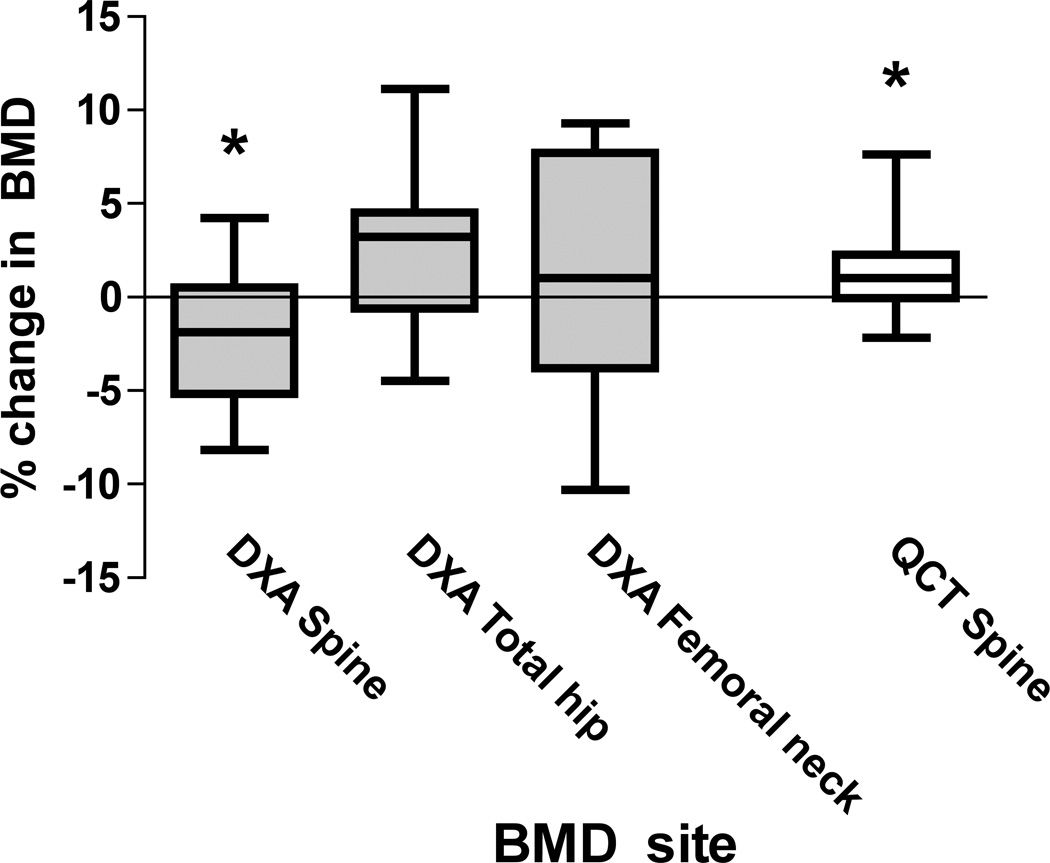
Major alterations in body composition, such as with obesity and weight loss, have complex effects on the measurement of bone mineral density (BMD) by dual-energy X-ray absorptiometry (DXA). The effects of altered body fat on quantitative computed tomography (QCT) measurements are unknown. We scanned a spine phantom by DXA and QCT before and after surrounding with sequential fat layers (up to 12 kg). In addition, we measured lumbar spine and proximal femur BMD by DXA and trabecular spine BMD by QCT in 13 adult volunteers before and after a simulated 7.5 kg increase in body fat. With the spine phantom, DXA BMD increased linearly with sequential fat layering at the normal (p < 0.01) and osteopenic (p < 0.01) levels, but QCT BMD did not change significantly. In humans, fat layering significantly reduced DXA spine BMD values (mean ± SD: -2.2 ± 3.7%, p = 0.05) and increased the variability of measurements. In contrast, fat layering increased QCT spine BMD in humans (mean ± SD: 1.5 ± 2.5%, p = 0.05). Fat layering did not change mean DXA BMD of the femoral neck or total hip in humans significantly, but measurements became less precise. Associations between baseline and fat-simulation scans were stronger for QCT of the spine (r(2)= 0.97) than for DXA of the spine (r(2)= 0.87), total hip (r(2) = 0.80), or femoral neck (r(2)= 0.75). Bland-Altman plots revealed that fat-associated errors were greater for DXA spine and hip BMD than for QCT trabecular spine BMD. Fat layering introduces error and decreases the reproducibility of DXA spine and hip BMD measurements in human volunteers. Although overlying fat also affects QCT BMD measurements, the error is smaller and more uniform than with DXA BMD. Caution must be used when interpreting BMD changes in humans whose body composition is changing.
Copyright © 2012 American Society for Bone and Mineral Research.
Conflict of interest statement
Figures

References
-
- Flegal KM, Carroll MD, Ogden CL, Curtin LR. Prevalence and trends in obesity among US adults, 1999–2008. JAMA. 2010;303(3):235–241. - PubMed
-
- Nelson L, Gulenchyn KY, Atthey M, Webber CE. Is a fixed value for the least significant change appropriate? J Clin Densitom. 2010;13(1):18–23. - PubMed
-
- Coates PS, Fernstrom JD, Fernstrom MH, Schauer PR, Greenspan SL. Gastric bypass surgery for morbid obesity leads to an increase in bone turnover and a decrease in bone mass. J Clin Endocrinol Metab. 2004;89(3):1061–1065. - PubMed
-
- von Mach MA, Stoeckli R, Bilz S, Kraenzlin M, Langer I, Keller U. Changes in bone mineral content after surgical treatment of morbid obesity. Metab Clin Exp. 2004;53(7):918–921. - PubMed
