Review
. 2012 Aug;33(8):1987-2002.
doi: 10.1002/hbm.21334. Epub 2011 Sep 13.

Human brain changes across the life span: a review of 56 longitudinal magnetic resonance imaging studies

Affiliations
Review

Human brain changes across the life span: a review of 56 longitudinal magnetic resonance imaging studies

Anna M Hedman et al. Hum Brain Mapp. 2012 Aug.

Abstract

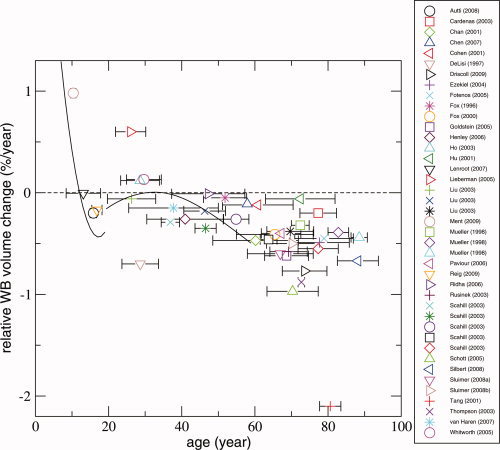
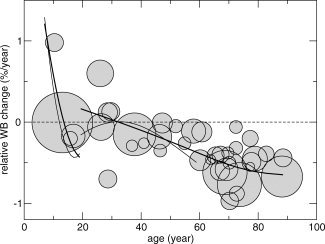
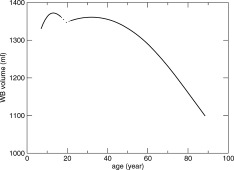
There is consistent evidence that brain volume changes in early and late life. Most longitudinal studies usually only span a few years and include a limited number of participants. In this review, we integrate findings from 56 longitudinal magnetic resonance imaging (MRI) studies on whole brain volume change in healthy individuals. The individual longitudinal MRI studies describe only the development in a limited age range. In total, 2,211 participants were included. Age at first measurement varied between 4 and 88 years of age. The studies included in this review were performed using a large range of methods (e.g., different scanner protocols and different acquisition parameters). We applied a weighted regression analysis to estimate the age dependency of the rate of relative annual brain volume change across studies. The results indicate that whole brain volume changes throughout the life span. A wave of growth occurs during childhood/adolescence, where around 9 years of age a 1% annual brain growth is found which levels off until at age 13 a gradual volume decrease sets in. During young adulthood, between ∼18 and 35 years of age, possibly another wave of growth occurs or at least a period of no brain tissue loss. After age 35 years, a steady volume loss is found of 0.2% per year, which accelerates gradually to an annual brain volume loss of 0.5% at age 60. The brains of people over 60 years of age show a steady volume loss of more than 0.5%. Understanding the mechanisms underlying these plastic brain changes may contribute to distinguishing progressive brain changes in psychiatric and neurological diseases from healthy aging processes. Hum Brain Mapp, 2012. © 2011 Wiley Periodicals, Inc.


Figures

Figure 1
Figure 1
Longitudinal magnetic resonance brain imaging studies measuring whole brain volume change with age in humans. The total number of studies, after excluding overlapping samples, was 33. Each data point represents a study or a particular age group from an individual study. The relative whole brain volume change in %/year (Q) was set out against the mean age in between the two time points. The horizontal bars represent the standard deviation for age at baseline for all subjects included in the study. The zero‐line indicates no whole brain volume change. Above zero indicates an increase in the whole brain volume while below zero represents a decrease in whole brain volume. Several studies reported results for different age groups [Liu et al.,2003; Mueller et al.,1998; Scahill et al.,2003]. These individual age groups are depicted separately in Figure 1; therefore, 41 data points are shown. Two studies reported their data as nonlinear trajectories [Lenroot et al.,2007; van Haren et al.,2008], and their respective trajectories are also shown here.
Figure 2
Figure 2
Fits that show the association between relative rate of whole brain volume change and age. Whole brain volume change data from the individual studies are shown as circles. The area of the circles scales with the number of subjects in the study (a larger area of the circle corresponds to more participants). Fits (with 3 degrees of freedom) were calculated to the data below and above age 19 separately (thick lines). Two studies reported their data as trajectories [Lenroot et al.,2007; van Haren et al.,2008], and these are made visible (thin lines).
Figure 3
Figure 3
Whole brain volume across the life span between 4 and 88 years of age. Whole brain volume as a function of age is obtained by numerical integration of the whole brain volume change fits with respect to age from Figure 2. As starting volume, the mean whole brain volume from a study of N = 210 nine‐year‐old twins was used [Peper et al.,2009]. The curves are dashed around age 18–21, indicating the uncertainty in this area, since only few data were available for fitting this age range. Two separate fits were calculated for the younger (<19 years) and older (>19 years) group.
Figure 4
Figure 4
a and b. GM and WM volume change with age. Total number of studies that presented data on GM (after excluding overlapping studies) was 10, while 9 studies presented data on WM. The relative GM and WM volume change in %/year (Q) was set out against the mean age in between the two time points. The zero‐line indicates no volume change. Above zero indicates an increase in the volume, whereas below zero represents a decrease in volume. The area of the circles scales as the number of subjects in the study. Fits for both GM and WM with age (with 3 degrees of freedom) were calculated to the data above age 19 (thick line). Two studies reported their GM and WM data as trajectories [Lenroot et al.,2007; van Haren et al.,2008], and these are made visible (thin lines). Liu et al. [2003] reported results for different age groups. These individual age groups are depicted separately; therefore, 12 data circles are shown for GM, while 11 data circles are shown for WM.

References

    1. Autti TH, Hämäläinen J, Mannerkoski M, Van Leemput KV, Aberg LE ( 2008): JNCL patients show marked brain volume alterations on longitudinal MRI in adolescence. J Neurol 255: 1226–1230. - PubMed
    1. Blumberg HP, Fredericks C, Wang F, Kalmar JH, Spencer L, Papademetris X, Pittman B, Martin A, Peterson BS, Fulbright RK, Krystal JH ( 2005): Preliminary evidence for persistent abnormalities in amygdala volumes in adolescents and young adults with bipolar disorder. Bipolar Disord 7: 570–576. - PMC - PubMed
    1. Brans RG, van Haren NE, van Baal GC, Schnack HG, Kahn RS, Hulshoff Pol HE ( 2008a): Heritability of changes in brain volume over time in twin pairs discordant for schizophrenia. Arch Gen Psychiatry 65: 1259–1268. - PubMed
    1. Brans RG, van Haren NE, van Baal GC, Staal WG, Schnack HG, Kahn RS, Hulshoff Pol HE ( 2008b): Longitudinal MRI study in schizophrenia patients and their healthy siblings. Br J Psychiatry 193: 422–423. - PubMed
    1. Brans RG, Kahn RS, Schnack HG, van Baal GC, Posthuma D, van Haren NE, Lepage C, Lerch JP, Collins DL, Evans AC, Boomsma DI, Hulshoff Pol HE ( 2010): Brain plasticity and intellectual ability are influenced by shared genes. J Neurosci 30: 5519–5524. - PMC - PubMed

Publication types