. 2011 Nov 2;133(43):17406-13.
doi: 10.1021/ja206849c. Epub 2011 Oct 4.

In situ AFM study of amelogenin assembly and disassembly dynamics on charged surfaces provides insights on matrix protein self-assembly

Affiliations

In situ AFM study of amelogenin assembly and disassembly dynamics on charged surfaces provides insights on matrix protein self-assembly

Chun-Long Chen et al. J Am Chem Soc. .

Abstract

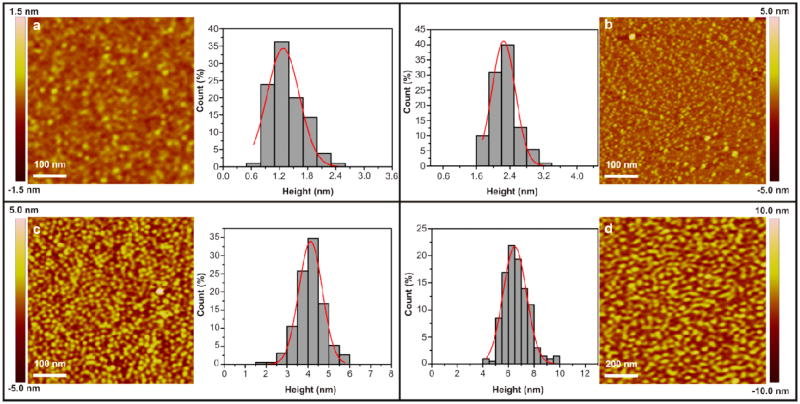
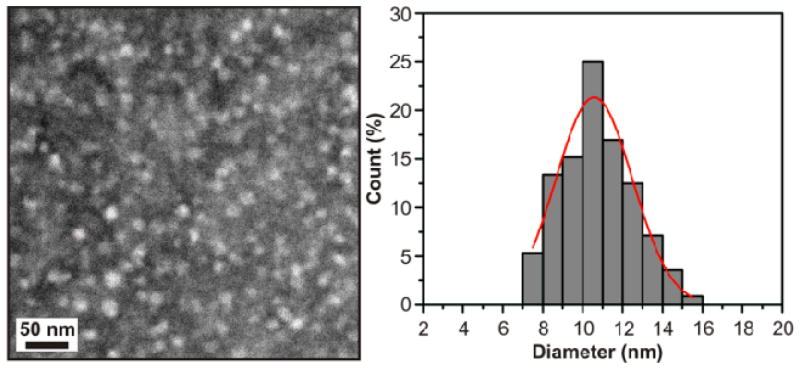
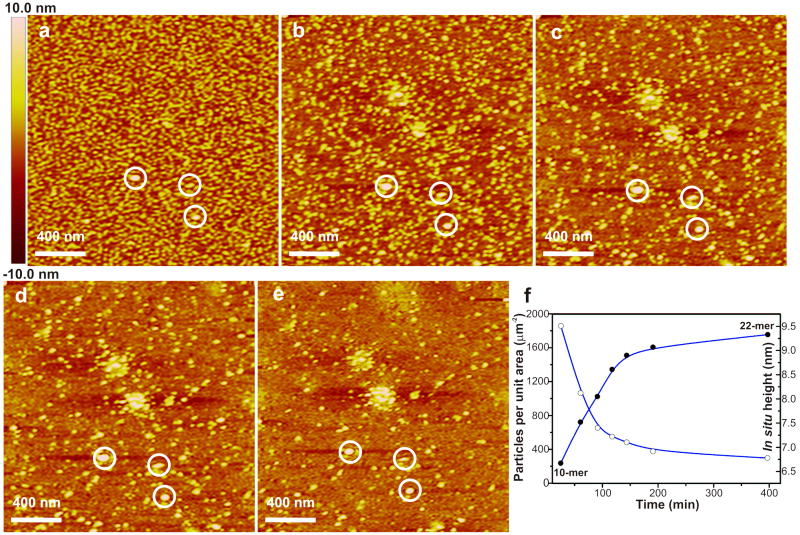
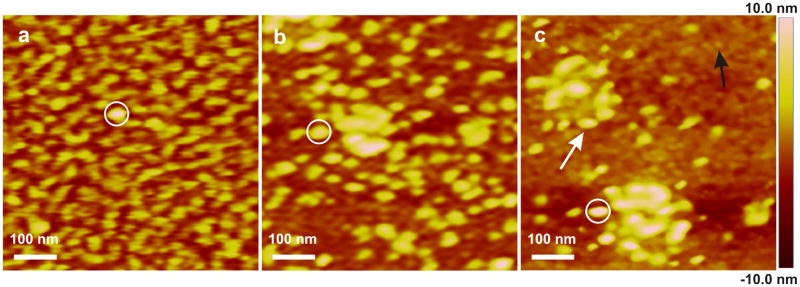
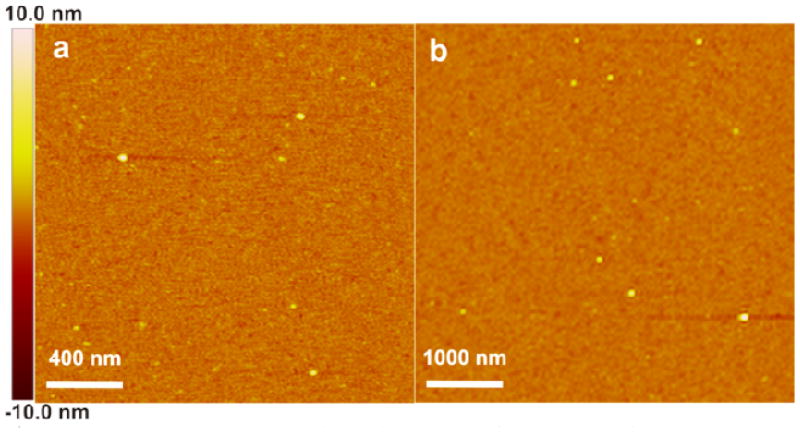
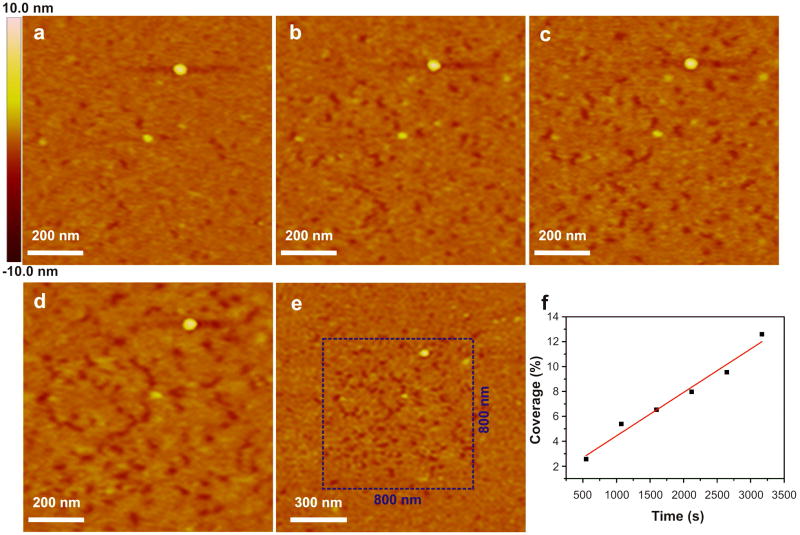
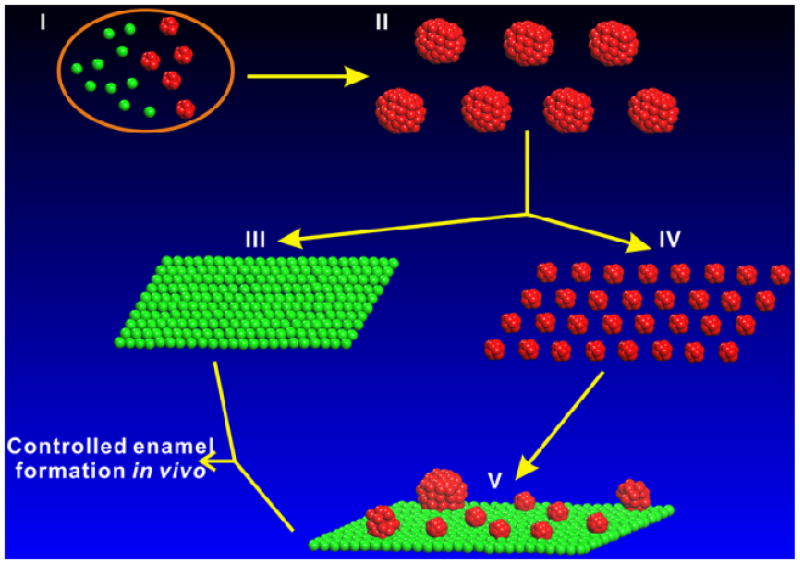
Because self-assembly of matrix proteins is a key step in hard tissue mineralization, developing an understanding of the assembly pathways and underlying mechanisms is likely to be important for successful hard tissue engineering. While many studies of matrix protein assembly have been performed on bulk solutions, in vivo these proteins are likely to be in contact with charged biological surfaces composed of lipids, proteins, or minerals. Here we report the results of an in situ atomic force microscopy (AFM) study of self-assembly by amelogenin--the principal protein of the extracellular matrix in developing enamel--in contact with two different charged substrates: hydrophilic negatively charged bare mica and positively charged 3-aminopropyl triethoxysilane (APS) silanized mica. First we demonstrate an AFM-based protocol for determining the size of both amelogenin monomers and oligomers. Using this protocol, we find that, although amelogenin exists primarily as ~26 nm in diameter nanospheres in bulk solution at a pH of 8.0 studied by dynamic light scattering, it behaves dramatically differently upon interacting with charged substrates at the same pH and exhibits complex substrate-dependent assembly pathways and dynamics. On positively charged APS-treated mica surfaces, amelogenin forms a relatively uniform population of decameric oligomers, which then transform into two main populations: higher-order assemblies of oligomers and amelogenin monomers, while on negatively charged bare mica surfaces, it forms a film of monomers that exhibits tip-induced desorption and patterning. The present study represents a successful attempt to identify the size of amelogenin oligomers and to directly monitor assembly and disassembly dynamics on surfaces. The findings have implications for amelogenin-controlled calcium phosphate mineralization in vitro and may offer new insights into in vivo self-assembly of matrix proteins as well as their control over hard tissue formation.


Figures

Figure 1
Figure 1
AFM height images of amelogenin particles on APS mica surfaces from 0.75 mg/mL protein solution in NaOAc-HOAc buffer (25 mM, pH3.8) or Tris-HCl buffer (25 mM, pH8.0). (a) Ex situ, pH 3.8, height = 1.4 ± 0.4 nm, based on 105 counts. (b) In situ, pH 3.8, height = 2.3 ± 0.3, based on 110 counts. (c) Ex situ, pH 8.0, height = 4.1 ± 0.6 nm, based on 190 counts. (d) In situ, pH 8.0, height = 6.7 ± 1.0 nm, based on 201 counts.
Figure 2
Figure 2
TEM image of amelogenin particles on a carbon grid at pH 8.0 (protein concentration = 0.75 mg/mL), diameter = 10.8 ± 1.8 nm, based on 112 counts.
Figure 3
Figure 3
In situ AFM images of amelogenin particles on APS mica (pH 8.0) at different time points showing the assembly pathway and kinetics. The three circled particles provide reference points. (a) t = 25.1 min. (b) t = 60.6 min. (c) t = 91.1 min. (d) t = 143.6 min. (e) t = 397.1 min. (f) Time evolution to show total number of particles per unit area (white dots) and height of oligomers (black dots).
Figure 4
Figure 4
In situ AFM images of amelogenin particles on APS mica (pH 8.0) at different time points. The circled particle provides a reference point. (a) t = 15.0 min. (b) t = 64.9 min. (c) t = 413.2 min. White and black arrows indicated amelogenin oligomer and monomer respectively.
Figure 5
Figure 5
In situ AFM height images of amelogenin particles on mica surface at pH8.0 from different protein concentrations (a) 0.75 mg/mL, (b) 2.0 mg/mL, in which amelogenin oligomers are bright yellow in color.
Figure 6
Figure 6
Tip-induced desorption of amelogenin. (a-e) In situ height images of amelogenin particles on mica during continuous scanning at constant force in buffered protein solution (protein concentration = 0.75 mg/mL, 25 mM pH 8.0 Tris-HCl buffer). (a) t = 548 s, (b) t = 1597 s, (c) t = 2121 s, (d) t = 3170 s, (e) t = 3613 s. (f) Time dependence of the percent coverage of amelogenin-free regions.
Figure 7
Figure 7
The proposed pathway of amelogenin self-assembly and structural dynamics in vivo. Intracellular amelogenin monomers (green) and hexamers (red) in ameloblast cells (I). amelogenin nanospheres assemble after secretion (II). Monolayer of amelogenin monomers forms after nanospheres interact with negatively charged hydrophilic surface (III). Decameric amelogenin oligomers form following disassembly of nanospheres through interaction with positively charged surfaces (IV). Decameric oligomers exhibit unexpected structural dynamics on positively charged surfaces in situ and form a mixture of higher-order assemblies of oligomers and monomers (V).

References

    1. Orgel J, Irving TC, Miller A, Wess TJ. Proc Natl Acad Sci U S A. 2006;103:9001. - PMC - PubMed
    1. Sleytr UB, Beveridge TJ. Trends Microbiol. 1999;7:253. - PubMed
    1. Fotin A, Cheng YF, Sliz P, Grigorieff N, Harrison SC, Kirchhausen T, Walz T. Nature. 2004;432:573. - PubMed
    1. Theil EC, Matzapetakis M, Liu XF. J Biol Inorg Chem. 2006;11:803. - PubMed
    1. George A, Ravindran S. Nano Today. 2010;5:254. - PMC - PubMed

Publication types

MeSH terms