

Optimisation of surface expression using the AIDA autotransporter
- PMID: 21917130
- PMCID: PMC3192670
- DOI: 10.1186/1475-2859-10-72
Optimisation of surface expression using the AIDA autotransporter
Abstract
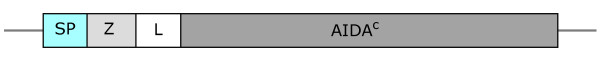
Background: Bacterial surface display is of interest in many applications, including live vaccine development, screening of protein libraries and the development of whole cell biocatalysts. The goal of this work was to understand which parameters result in production of large quantities of cells that at the same time express desired levels of the chosen protein on the cell surface. For this purpose, staphylococcal protein Z was expressed using the AIDA autotransporter in Escherichia coli.
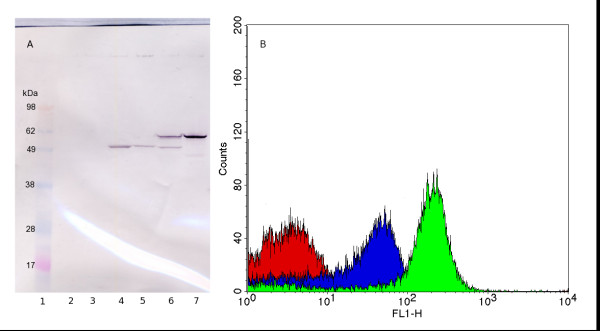
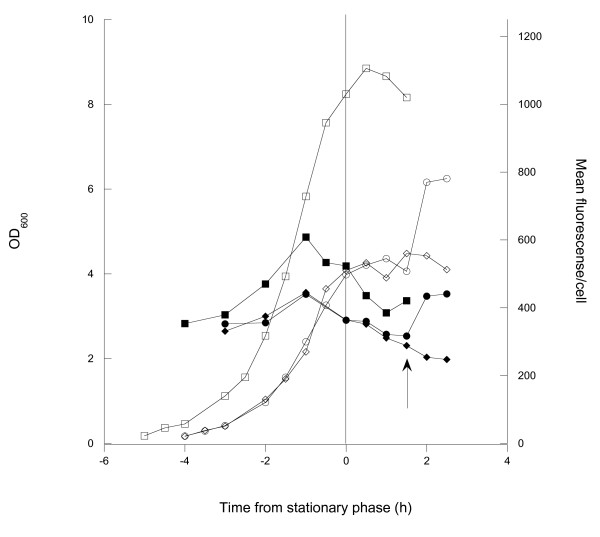
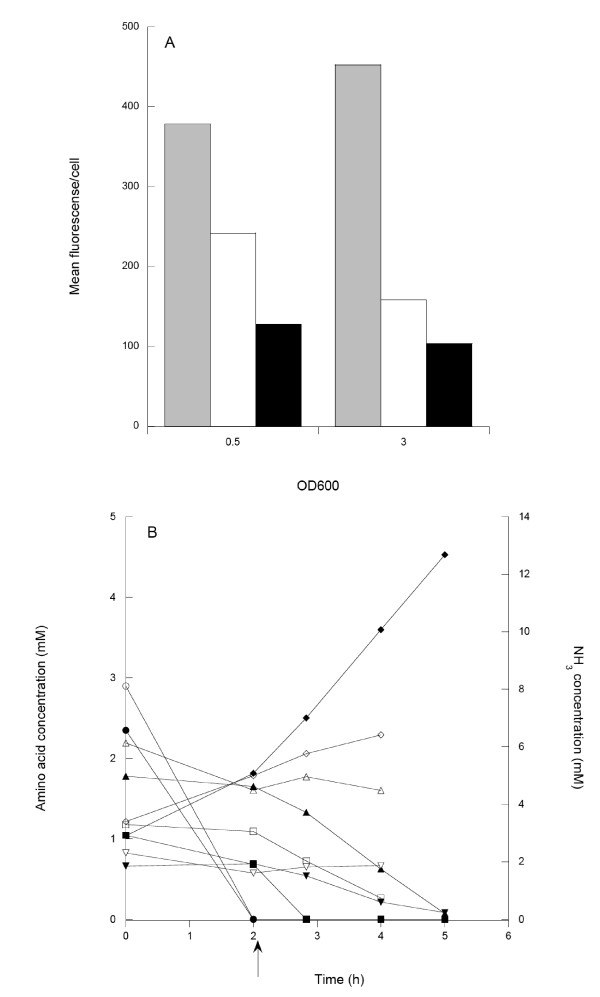
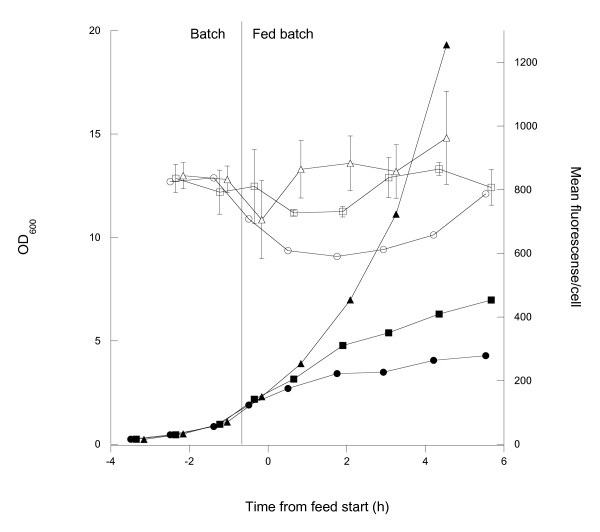
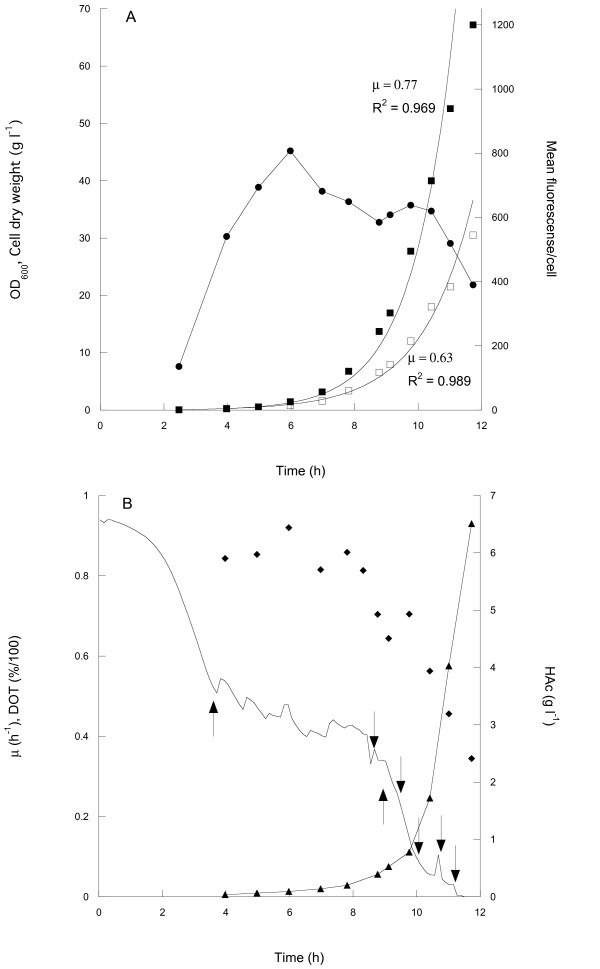
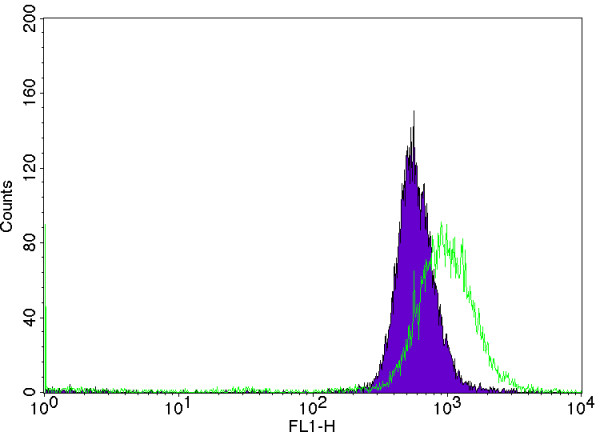
Results: The use of an OmpT-negative E. coli mutant resulted in successful expression of the protein on the surface, while a clear degradation pattern was found in the wild type. The expression in the mutant resulted also in a more narrow distribution of the surface-anchored protein within the population. Medium optimisation showed that minimal medium with glucose gave more than four times as high expression as LB-medium. Glucose limited fed-batch was used to increase the cell productivity and the highest protein levels were found at the highest feed rates. A maintained high surface expression up to cell dry weights of 18 g l-1 could also be achieved by repeated glucose additions in batch cultivation where production was eventually reduced by low oxygen levels. In spite of this, the distribution in the bacterial population of the surface protein was narrower using the batch technique.
Conclusions: A number of parameters in recombinant protein production were seen to influence the surface expression of the model protein with respect both to the productivity and to the display on the individual cell. The choice of medium and the cell design to remove proteolytic cleavage were however the most important. Both fed-batch and batch processing can be successfully used, but prolonged batch processing is probably only possible if the chosen strain has a low acetic acid production.
Figures
Similar articles
-
An engineered autotransporter-based surface expression vector enables efficient display of Affibody molecules on OmpT-negative E. coli as well as protease-mediated secretion in OmpT-positive strains.Microb Cell Fact. 2014 Dec 30;13:179. doi: 10.1186/s12934-014-0179-z. Microb Cell Fact. 2014. PMID: 25547008 Free PMC article.
-
Surface display of the receptor-binding domain of the F17a-G fimbrial adhesin through the autotransporter AIDA-I leads to permeability of bacterial cells.Microbiology (Reading). 2009 Feb;155(Pt 2):468-476. doi: 10.1099/mic.0.022327-0. Microbiology (Reading). 2009. PMID: 19202095
-
Characterization of the essential transport function of the AIDA-I autotransporter and evidence supporting structural predictions.J Bacteriol. 1999 Nov;181(22):7014-20. doi: 10.1128/JB.181.22.7014-7020.1999. J Bacteriol. 1999. PMID: 10559167 Free PMC article.
-
The fed-batch principle for the molecular biology lab: controlled nutrient diets in ready-made media improve production of recombinant proteins in Escherichia coli.Microb Cell Fact. 2016 Jun 17;15(1):110. doi: 10.1186/s12934-016-0513-8. Microb Cell Fact. 2016. PMID: 27317421 Free PMC article. Review.
-
The autodisplay story, from discovery to biotechnical and biomedical applications.Microbiol Mol Biol Rev. 2007 Dec;71(4):600-19. doi: 10.1128/MMBR.00011-07. Microbiol Mol Biol Rev. 2007. PMID: 18063719 Free PMC article. Review.
Cited by
-
Surface expression of ω-transaminase in Escherichia coli.Appl Environ Microbiol. 2014 Apr;80(7):2293-8. doi: 10.1128/AEM.03678-13. Epub 2014 Jan 31. Appl Environ Microbiol. 2014. PMID: 24487538 Free PMC article.
-
Ag43-mediated display of a thermostable β-glucosidase in Escherichia coli and its use for simultaneous saccharification and fermentation at high temperatures.Microb Cell Fact. 2014 Aug 1;13:106. doi: 10.1186/s12934-014-0106-3. Microb Cell Fact. 2014. PMID: 25078445 Free PMC article.
-
Improved cell surface display of Salmonella enterica serovar Enteritidis antigens in Escherichia coli.Microb Cell Fact. 2015 Apr 9;14:47. doi: 10.1186/s12934-015-0227-3. Microb Cell Fact. 2015. PMID: 25889453 Free PMC article.
-
Engineering Ag43 Signal Peptides with Bacterial Display and Selection.Methods Protoc. 2022 Dec 23;6(1):1. doi: 10.3390/mps6010001. Methods Protoc. 2022. PMID: 36648950 Free PMC article.
-
An engineered autotransporter-based surface expression vector enables efficient display of Affibody molecules on OmpT-negative E. coli as well as protease-mediated secretion in OmpT-positive strains.Microb Cell Fact. 2014 Dec 30;13:179. doi: 10.1186/s12934-014-0179-z. Microb Cell Fact. 2014. PMID: 25547008 Free PMC article.
References
Publication types
MeSH terms
Substances
LinkOut - more resources
Full Text Sources
Other Literature Sources
