

Direct structural analysis of modified RNA by fluorescent in-line probing
- PMID: 21917852
- PMCID: PMC3258135
- DOI: 10.1093/nar/gkr733
Direct structural analysis of modified RNA by fluorescent in-line probing
Abstract
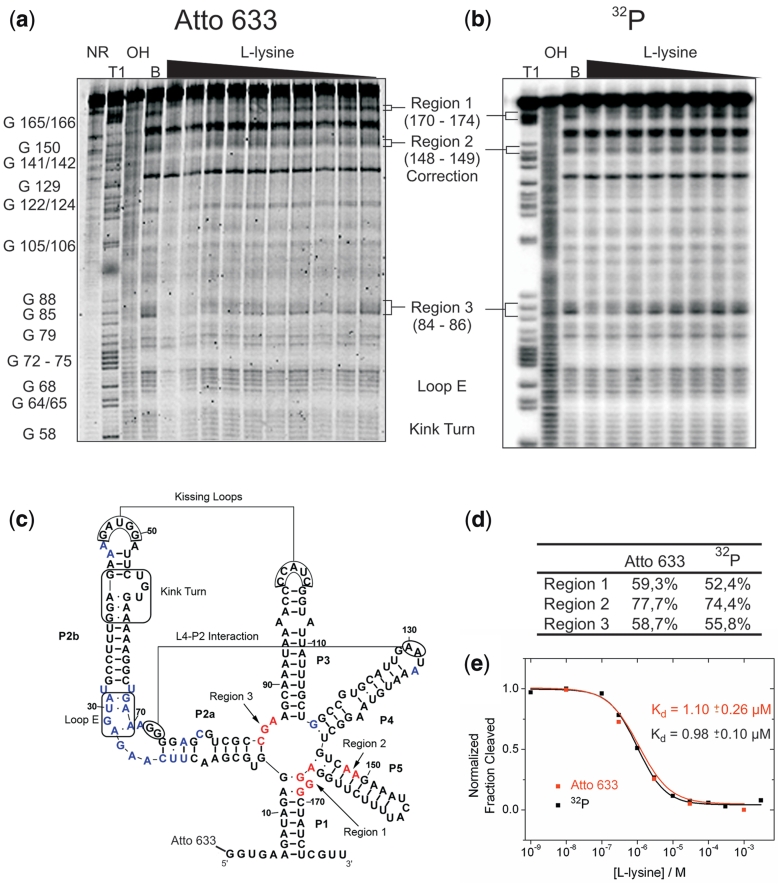
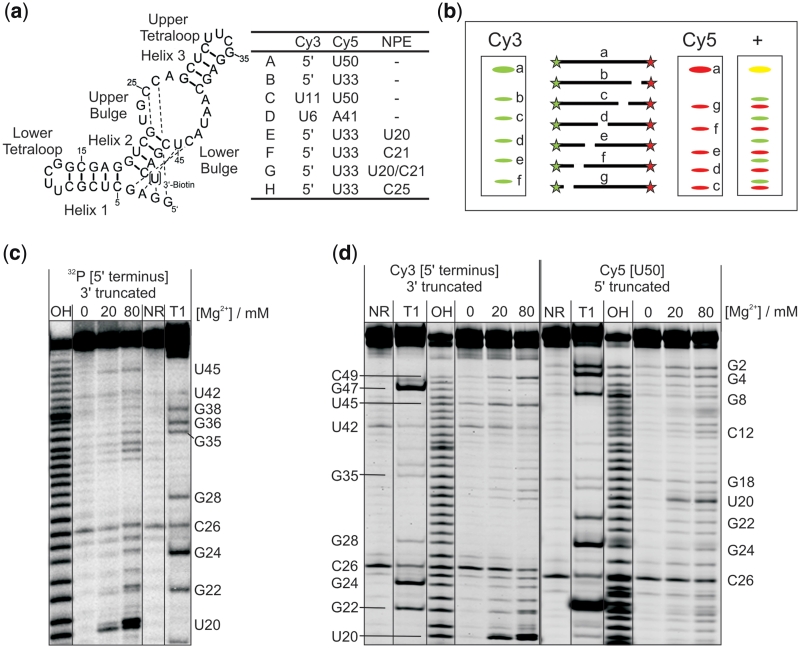
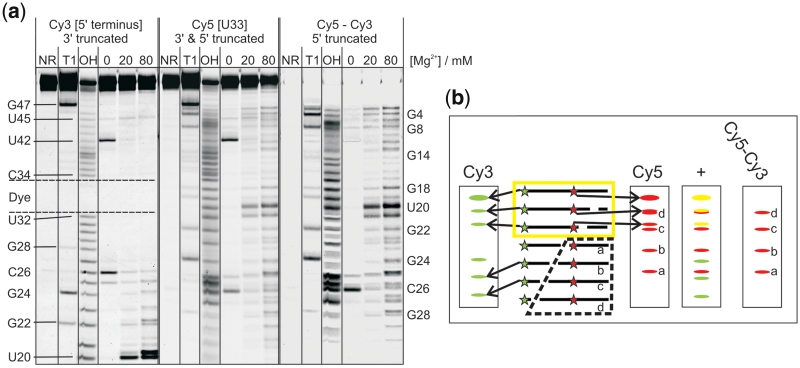
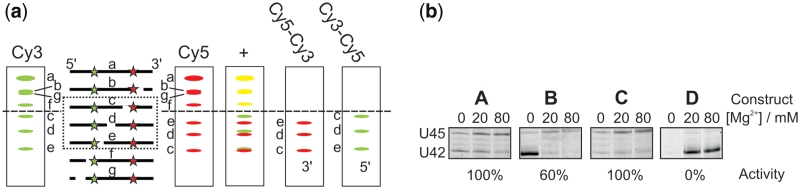
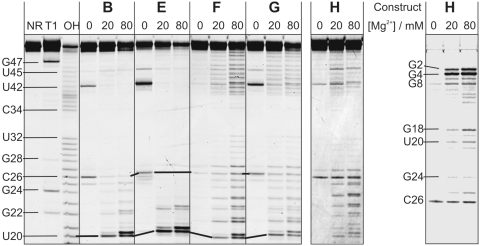
Chemical probing is a common method for the structural characterization of RNA. Typically, RNA is radioactively end-labelled, subjected to probing conditions, and the cleavage fragment pattern is analysed by gel electrophoresis. In recent years, many chemical modifications, like fluorophores, were introduced into RNA, but methods are lacking that detect the influence of the modification on the RNA structure with single-nucleotide resolution. Here, we first demonstrate that a 5'-terminal (32)P label can be replaced by a dye label for in-line probing of riboswitch RNAs. Next, we show that small, highly structured FRET-labelled Diels-Alderase ribozymes can be directly probed, using the internal or terminal FRET dyes as reporters. The probing patterns indeed reveal whether or not the attachment of the dyes influences the structure. The existence of two dye labels in typical FRET constructs is found to be beneficial, as 'duplexing' allows observation of the complete RNA on a single gel. Structural information can be derived from the probing gels by deconvolution of the superimposed band patterns. Finally, we use fluorescent in-line probing to experimentally validate the structural consequences of photocaging, unambiguously demonstrating the intentional destruction of selected elements of secondary or tertiary structure.
Figures
Similar articles
-
Intracellular ribozyme-catalyzed trans-cleavage of RNA monitored by fluorescence resonance energy transfer.RNA. 2000 Apr;6(4):628-37. doi: 10.1017/s1355838200990964. RNA. 2000. PMID: 10786853 Free PMC article.
-
Probing RNA structure and interaction dynamics at the single molecule level.Methods. 2019 Jun 1;162-163:3-11. doi: 10.1016/j.ymeth.2019.04.002. Epub 2019 Apr 3. Methods. 2019. PMID: 30951833 Free PMC article. Review.
-
Architecture of a Diels-Alderase ribozyme with a preformed catalytic pocket.Chem Biol. 2004 Sep;11(9):1217-27. doi: 10.1016/j.chembiol.2004.06.011. Chem Biol. 2004. PMID: 15380182
-
Computational design and experimental validation of oligonucleotide-sensing allosteric ribozymes.Nat Biotechnol. 2005 Nov;23(11):1424-33. doi: 10.1038/nbt1155. Epub 2005 Oct 23. Nat Biotechnol. 2005. PMID: 16244657
-
Characterizing 3D RNA structure by single molecule FRET.Methods. 2016 Jul 1;103:57-67. doi: 10.1016/j.ymeth.2016.02.004. Epub 2016 Feb 4. Methods. 2016. PMID: 26853327 Review.
Cited by
-
Site-specific terminal and internal labeling of RNA by poly(A) polymerase tailing and copper-catalyzed or copper-free strain-promoted click chemistry.Nucleic Acids Res. 2012 May;40(10):e78. doi: 10.1093/nar/gks062. Epub 2012 Feb 16. Nucleic Acids Res. 2012. PMID: 22344697 Free PMC article.
-
Rational design of a synthetic mammalian riboswitch as a ligand-responsive -1 ribosomal frame-shifting stimulator.Nucleic Acids Res. 2016 Oct 14;44(18):9005-9015. doi: 10.1093/nar/gkw718. Epub 2016 Aug 12. Nucleic Acids Res. 2016. PMID: 27521370 Free PMC article.
-
Protein unties the pseudoknot: S1-mediated unfolding of RNA higher order structure.Nucleic Acids Res. 2020 Feb 28;48(4):2107-2125. doi: 10.1093/nar/gkz1166. Nucleic Acids Res. 2020. PMID: 31832686 Free PMC article.
-
Understanding in-line probing experiments by modeling cleavage of nonreactive RNA nucleotides.RNA. 2017 May;23(5):712-720. doi: 10.1261/rna.060442.116. Epub 2017 Feb 15. RNA. 2017. PMID: 28202709 Free PMC article.
-
RNA Structural Differentiation: Opportunities with Pattern Recognition.Biochemistry. 2019 Jan 29;58(4):199-213. doi: 10.1021/acs.biochem.8b01090. Epub 2018 Dec 18. Biochemistry. 2019. PMID: 30513196 Free PMC article. Review.
References
-
- Stern S, Moazed D, Noller HF. Structural analysis of RNA using chemical and enzymatic probing monitored by primer extension. Methods Enzymol. 1988;164:481–489. - PubMed
-
- Forconi M, Herschlag D. Metal ion-based RNA cleavage as a structural probe. Methods Enzymol. 2009;468:91–106. - PubMed
-
- Sigel RK, Vaidya A, Pyle AM. Metal ion binding sites in a group II intron core. Nat. Struct. Biol. 2000;7:1111–1116. - PubMed
Publication types
MeSH terms
Substances
LinkOut - more resources
Full Text Sources
Other Literature Sources
