. 2011 Dec;96(12):3775-84.
doi: 10.1210/jc.2011-1565. Epub 2011 Sep 14.

Urine steroid metabolomics as a biomarker tool for detecting malignancy in adrenal tumors

Affiliations

Urine steroid metabolomics as a biomarker tool for detecting malignancy in adrenal tumors

Wiebke Arlt et al. J Clin Endocrinol Metab. 2011 Dec.

Abstract

Context: Adrenal tumors have a prevalence of around 2% in the general population. Adrenocortical carcinoma (ACC) is rare but accounts for 2-11% of incidentally discovered adrenal masses. Differentiating ACC from adrenocortical adenoma (ACA) represents a diagnostic challenge in patients with adrenal incidentalomas, with tumor size, imaging, and even histology all providing unsatisfactory predictive values.

Objective: Here we developed a novel steroid metabolomic approach, mass spectrometry-based steroid profiling followed by machine learning analysis, and examined its diagnostic value for the detection of adrenal malignancy.

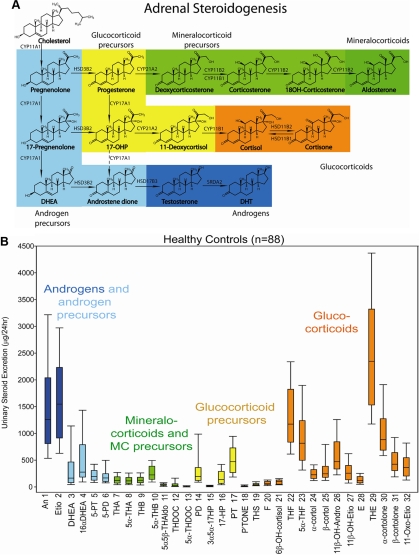
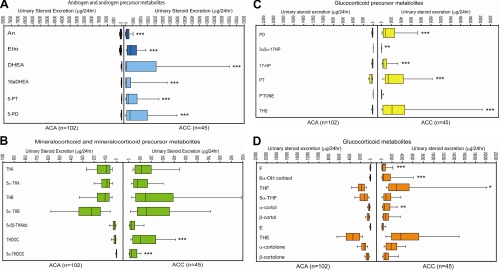
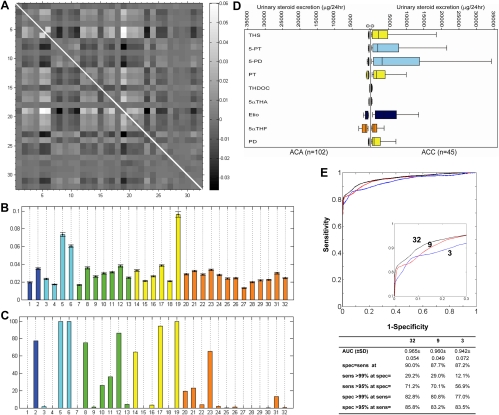
Design: Quantification of 32 distinct adrenal derived steroids was carried out by gas chromatography/mass spectrometry in 24-h urine samples from 102 ACA patients (age range 19-84 yr) and 45 ACC patients (20-80 yr). Underlying diagnosis was ascertained by histology and metastasis in ACC and by clinical follow-up [median duration 52 (range 26-201) months] without evidence of metastasis in ACA. Steroid excretion data were subjected to generalized matrix learning vector quantization (GMLVQ) to identify the most discriminative steroids.

Results: Steroid profiling revealed a pattern of predominantly immature, early-stage steroidogenesis in ACC. GMLVQ analysis identified a subset of nine steroids that performed best in differentiating ACA from ACC. Receiver-operating characteristics analysis of GMLVQ results demonstrated sensitivity = specificity = 90% (area under the curve = 0.97) employing all 32 steroids and sensitivity = specificity = 88% (area under the curve = 0.96) when using only the nine most differentiating markers.

Conclusions: Urine steroid metabolomics is a novel, highly sensitive, and specific biomarker tool for discriminating benign from malignant adrenal tumors, with obvious promise for the diagnostic work-up of patients with adrenal incidentalomas.


Figures

Fig. 1.
Fig. 1.
A, Schematic representation of steroidogenesis depicting the major products of adrenocortical steroid synthesis, the mineralocorticoid aldosterone (dark green) and its precursors (light green), glucocorticoid precursors (yellow), the active glucocorticoid cortisol (orange) and its metabolite cortisone, and the adrenal androgens and their precursors (light blue). Synthesis of active androgens (dark blue) mainly takes place in the gonads. B, The 24-h urinary steroid metabolite excretion in healthy controls (n = 88). Box plots represent median and interquartile ranges; the whiskers represent 5th and 95th percentile, respectively. Color coding of steroid metabolites mirrors that used for depicting the major adrenal corticosteroid classes in A. CYP, Cytochrome P450; HSD, hydroxysteroid dehydrogenase; DHT, 5α-dihydrotestosterone.
Fig. 2.
Fig. 2.
Steroid metabolite excretion in ACA (n = 102) and ACC (n = 45) according to steroid classes. A, Metabolites of adrenal androgen precursors and active androgens; B, metabolites of mineralocorticoids and their precursors; C, metabolites of glucocorticoid precursors; D, cortisol and cortisone metabolites. Box plots represent median and interquartile ranges; the whiskers represent 5th and 95th percentile, respectively. *, P < 0.05; **, P < 0.01; ***, P < 0.001 comparing ACA with ACC.
Fig. 3.
Fig. 3.
Results of GMLVQ analysis. A, Relevance matrix as obtained by GMLVQ as an average of 1000 randomized training runs. The panel provides a gray-scale representation of the off-diagonal elements in the average relevance matrix. Both the x- and the y-axes correspond to the numbering of individual steroids (n = 32) in Fig. 1 and Supplemental Table 1; each square corresponds to the combination of two steroids. Large positive and negative values as represented by bright and dark squares, respectively, indicate that the corresponding pair of steroid markers is highly relevant for the discrimination of ACC from ACA. The gray scale on the right defines the numerical values of the matrix elements. For clarity, the diagonal elements of the relevance matrix have been omitted, as indicated by the white line. B, All 32 diagonal elements of the relevance matrix, quantifying the significance of each single steroid marker for the discrimination of ACC from ACA (color code as in Fig. 1B), with all significances adding up to the sum of 1. Error bars correspond to the observed sd over the 1000 randomized training runs. C, Respective percentages of the 1000 randomized training runs in which single steroid features were identified as being among the nine most relevant features for the differentiation of ACC from ACA. D, Steroid biomarkers selected after GMLVQ analysis as the nine most relevant markers for differentiating ACC from ACA. Box plots represent median and interquartile ranges; the whiskers represent 5th and 95th percentile, respectively (color code as in Fig. 1B). E, ROC curve for all steroid metabolites (n = 32) and the three and nine steroid markers identified as most discriminating. The inset represents a magnification of the upper left-hand corner of the ROC curves, provided for visual clarity. Numerical characteristics are shown of the threshold-average ROC curves for all 32 steroids and the subsets of three steroids (THS, 5-PT, and 5-PD) and nine steroids [THS, 5-PT, 5-PD, PT, THDOC, 5αTHA Etio, 5αTHF, and PD; for explanation of steriod metabolite abbreviations see Supplemental Table 1] identified as most discriminative after GMLVQ analysis. ROC curves and all values for areas under the curve (AUC) and sensitivity (sens) and specificity (spec) correspond to average test set performances over 1000 random splits of the data set into 90% training data and 10% test data.

Comment in

  • A multi-test strategy for adrenal tumours.
    Turcu AF, Walch AK. Turcu AF, et al. Lancet Diabetes Endocrinol. 2020 Sep;8(9):733-734. doi: 10.1016/S2213-8587(20)30224-2. Epub 2020 Jul 23. Lancet Diabetes Endocrinol. 2020. PMID: 32711726 No abstract available.

References

    1. Grumbach MM, Biller BM, Braunstein GD, Campbell KK, Carney JA, Godley PA, Harris EL, Lee JK, Oertel YC, Posner MC, Schlechte JA, Wieand HS. 2003. Management of the clinically inapparent adrenal mass (“incidentaloma”). Ann Intern Med 138:424–429 - PubMed
    1. Mansmann G, Lau J, Balk E, Rothberg M, Miyachi Y, Bornstein SR. 2004. The clinically inapparent adrenal mass: update in diagnosis and management. Endocr Rev 25:309–340 - PubMed
    1. Barzon L, Sonino N, Fallo F, Palu G, Boscaro M. 2003. Prevalence and natural history of adrenal incidentalomas. Eur J Endocrinol 149:273–285 - PubMed
    1. Terzolo M, Reimondo G, Angeli A. 2009. Definition of an optimal strategy to evaluate and follow-up adrenal incidentalomas: time for further research. Eur J Endocrinol 161:529–532 - PubMed
    1. Young WF., Jr 2007. Clinical practice. The incidentally discovered adrenal mass. N Engl J Med 356:601–610 - PubMed

Publication types

MeSH terms