

Natality decline and miscarriages associated with the 1918 influenza pandemic: the Scandinavian and United States experiences
- PMID: 21917887
- PMCID: PMC3203382
- DOI: 10.1093/infdis/jir510
Natality decline and miscarriages associated with the 1918 influenza pandemic: the Scandinavian and United States experiences
Abstract
Background: Although pregnancy is a recognized risk factor for severe influenza infection, the effect of influenza on miscarriages and births remains unclear. We examined the relationship between influenza and birth rates during the 1918 pandemic in the United States, Denmark, Sweden, and Norway.
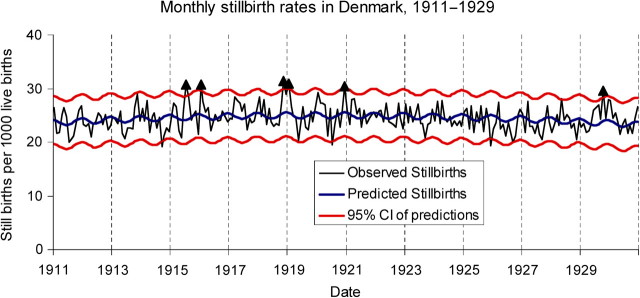
Methods: We compiled monthly birth rates from 1911 through 1930 in 3 Scandinavian countries and the United States, identified periods of unusually low or high birth rates, and quantified births as "missing" or "in excess" of the normal expectation. Using monthly influenza data, we correlated the timing of peak pandemic exposure and depressions in birth rates, and identified pregnancy stages at risk of influenza-related miscarriage.
Results: Birth rates declined in all study populations in spring 1919 by a mean of 2.2 births per 1000 persons, representing a 5%-15% drop below baseline levels (P < .05). The 1919 natality depression reached its trough 6.1-6.8 months after the autumn pandemic peak, suggesting that missing births were attributable to excess first trimester miscarriages in ∼1 in 10 women who were pregnant during the peak of the pandemic. Pandemic-related mortality was insufficient to explain observed patterns.
Conclusions: The observed birth depressions were consistent with pandemic influenza causing first trimester miscarriages in ∼1 in 10 pregnant women. Causality is suggested by temporal synchrony across geographical areas.
Figures


Comment in
-
Broadening indications for maternal influenza vaccination.J Infect Dis. 2011 Oct 15;204(8):1151-3. doi: 10.1093/infdis/jir513. J Infect Dis. 2011. PMID: 21917885 No abstract available.
-
Fertility fluctuations in times of war and pandemic influenza.J Infect Dis. 2012 Jul 1;206(1):140-1; author reply 141-3. doi: 10.1093/infdis/jis315. Epub 2012 Apr 25. J Infect Dis. 2012. PMID: 22535995 No abstract available.
Similar articles
-
Fertility fluctuations in times of war and pandemic influenza.J Infect Dis. 2012 Jul 1;206(1):140-1; author reply 141-3. doi: 10.1093/infdis/jis315. Epub 2012 Apr 25. J Infect Dis. 2012. PMID: 22535995 No abstract available.
-
Broadening indications for maternal influenza vaccination.J Infect Dis. 2011 Oct 15;204(8):1151-3. doi: 10.1093/infdis/jir513. J Infect Dis. 2011. PMID: 21917885 No abstract available.
-
The Relationship Between 2009 Pandemic H1N1 Influenza During Pregnancy and Preterm Birth: A Population-based Cohort Study.Epidemiology. 2018 Jan;29(1):107-116. doi: 10.1097/EDE.0000000000000753. Epidemiology. 2018. PMID: 28930786
-
Safety of oseltamivir in pregnancy: a review of preclinical and clinical data.Drug Saf. 2010 Aug 1;33(8):631-42. doi: 10.2165/11536370-000000000-00000. Drug Saf. 2010. PMID: 20635821 Review.
-
Effects of influenza on pregnant women and infants.Am J Obstet Gynecol. 2012 Sep;207(3 Suppl):S3-8. doi: 10.1016/j.ajog.2012.06.068. Epub 2012 Jul 9. Am J Obstet Gynecol. 2012. PMID: 22920056 Review.
Cited by
-
The association between seasonal influenza-like illness cases and foetal death: a time series analysis.Epidemiol Infect. 2018 Dec 3;147:e61. doi: 10.1017/S0950268818003254. Epidemiol Infect. 2018. PMID: 30501687 Free PMC article.
-
The health and demographic impacts of the "Russian flu" pandemic in Switzerland in 1889/1890 and in the years thereafter.Epidemiol Infect. 2024 Nov 19;152:e174. doi: 10.1017/S0950268824001651. Epidemiol Infect. 2024. PMID: 39557608 Free PMC article.
-
Beyond COVID: towards a transdisciplinary synthesis for understanding responses and developing pandemic preparedness in Alaska.Int J Circumpolar Health. 2024 Dec;83(1):2404273. doi: 10.1080/22423982.2024.2404273. Epub 2024 Sep 16. Int J Circumpolar Health. 2024. PMID: 39283062 Free PMC article. Review.
-
The role of infection in miscarriage.Hum Reprod Update. 2016 Jan-Feb;22(1):116-33. doi: 10.1093/humupd/dmv041. Epub 2015 Sep 19. Hum Reprod Update. 2016. PMID: 26386469 Free PMC article. Review.
-
A Retrospective observational cohort study of the effect of antenatal influenza vaccination on birth outcomes in Cape Town, South Africa, 2015-2016.Influenza Other Respir Viruses. 2021 Jul;15(4):446-456. doi: 10.1111/irv.12836. Epub 2021 Jan 16. Influenza Other Respir Viruses. 2021. PMID: 33452708 Free PMC article.
References
Publication types
MeSH terms
Grants and funding
LinkOut - more resources
Full Text Sources
Medical
