

Building multi-marker algorithms for disease prediction-the role of correlations among markers
- PMID: 21918599
- PMCID: PMC3169344
- DOI: 10.4137/BMI.S7513
Building multi-marker algorithms for disease prediction-the role of correlations among markers
Abstract
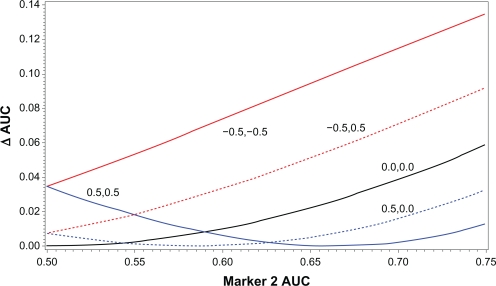
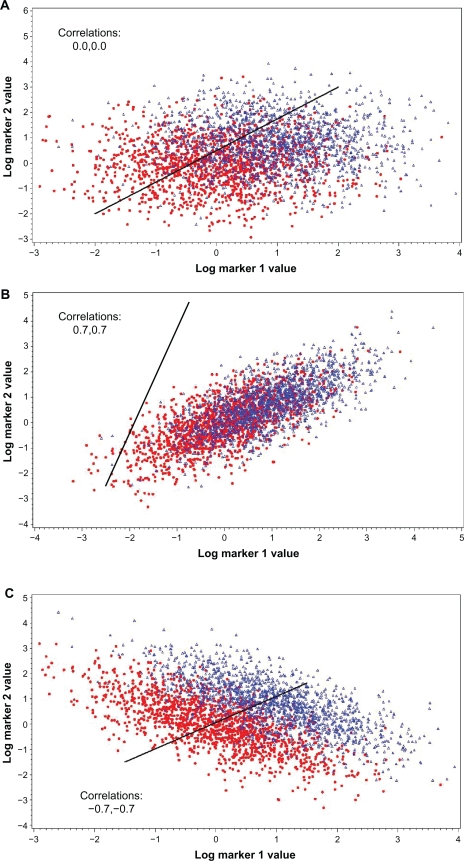
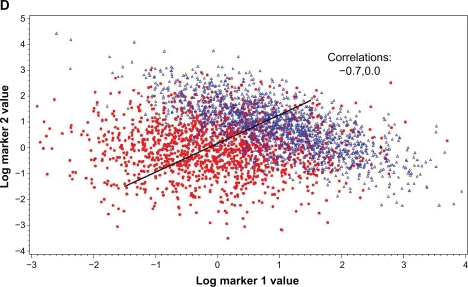
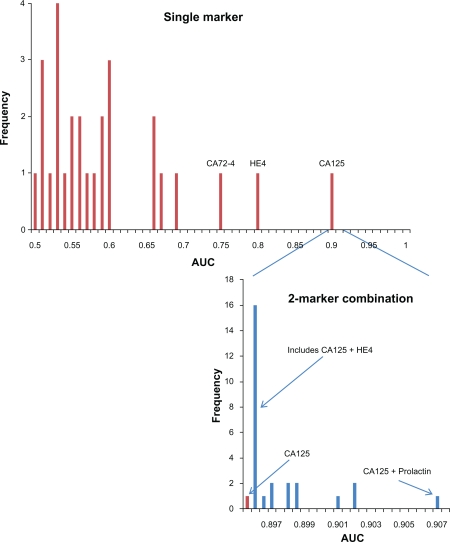
A widely held viewpoint in the field of predictive biomarkers for disease holds that no single marker can provide high enough discrimination and that a panel of markers, combined in some type of algorithm, will be needed. Motivated by a recent study where 27 additional markers for ovarian cancer, many of which had good predictive value alone, failed to substantially increase the predictive ability of the primary marker of CA125, we explore the effect of additional markers on the area under the ROC curve (AUC). We develop a statistical model based on the multivariate normal distribution and linear algorithms and use it to explore how the magnitude and direction of statistical correlation among the markers (in diseased and in non-diseased) is critical in determining the added predictive value of additional markers. We show mathematically and empirically that if the additional marker(s) is negatively correlated with the primary marker, then it will always be able to provide increased AUC when combined with the primary marker (as compared to that obtained with the primary marker alone), even if it has little predictive ability on its own. In contrast, if the additional marker(s) is positively correlated with the primary marker, then it is unlikely to substantially increase the AUC when combined with the primary marker, even when it has good predictive ability on its own. Thus, univariate analyses alone may not be the best approach in choosing which markers to combine in a predictive panel of markers; patterns of statistical correlation should be considered in ranking top-performing biomarkers.
Keywords: ROC AUC; biomarkers; correlation; linear algorithm; multivariate normal distribution.
Figures
References
-
- Baker S. Identifying combinations of cancer markers for further study as triggers of early intervention. Biometrics. 2000;56:1082–7. - PubMed
-
- Pepe MS, Thompson ML. Combining diagnostic tests results to increase accuracy. Biostatistics. 2000;1:123–40. - PubMed
-
- Pepe MS, Cai T, Longton G. Combining predictors for classification using the area under the receiver operating characteristic curve. Biometrics. 2006;62:221–9. - PubMed
LinkOut - more resources
Full Text Sources
Research Materials
Miscellaneous
