

Neonatal mortality levels for 193 countries in 2009 with trends since 1990: a systematic analysis of progress, projections, and priorities
- PMID: 21918640
- PMCID: PMC3168874
- DOI: 10.1371/journal.pmed.1001080
Neonatal mortality levels for 193 countries in 2009 with trends since 1990: a systematic analysis of progress, projections, and priorities
Abstract
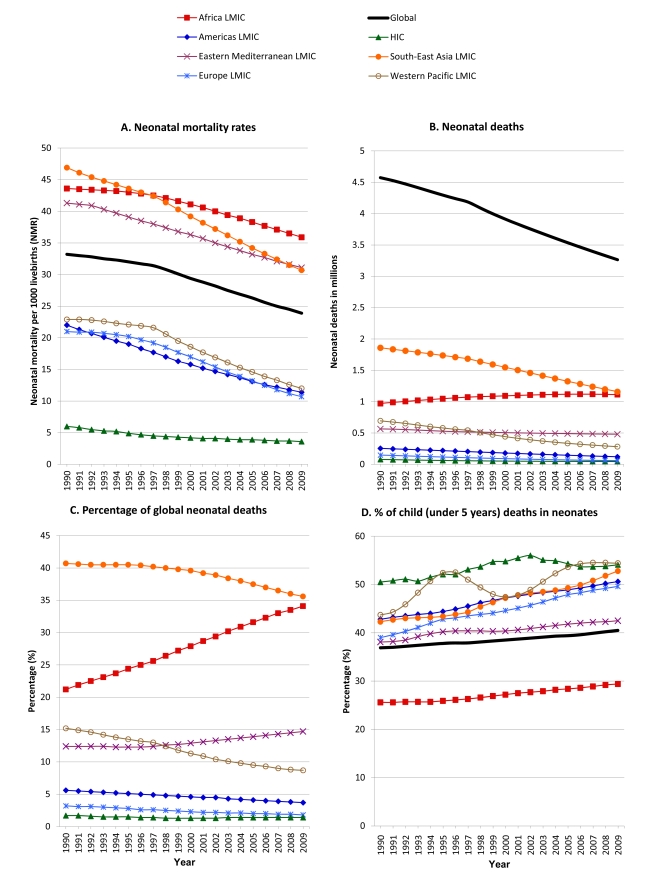
Background: Historically, the main focus of studies of childhood mortality has been the infant and under-five mortality rates. Neonatal mortality (deaths <28 days of age) has received limited attention, although such deaths account for about 41% of all child deaths. To better assess progress, we developed annual estimates for neonatal mortality rates (NMRs) and neonatal deaths for 193 countries for the period 1990-2009 with forecasts into the future.
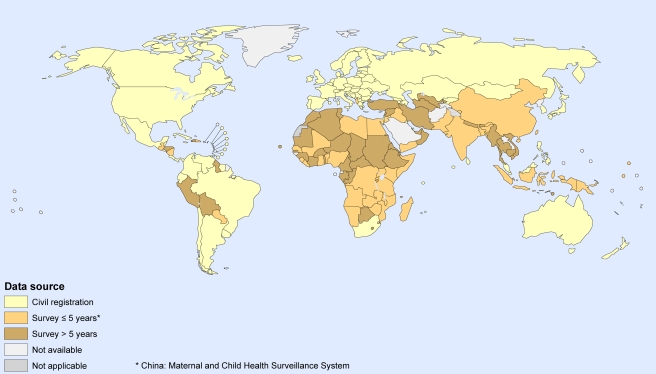
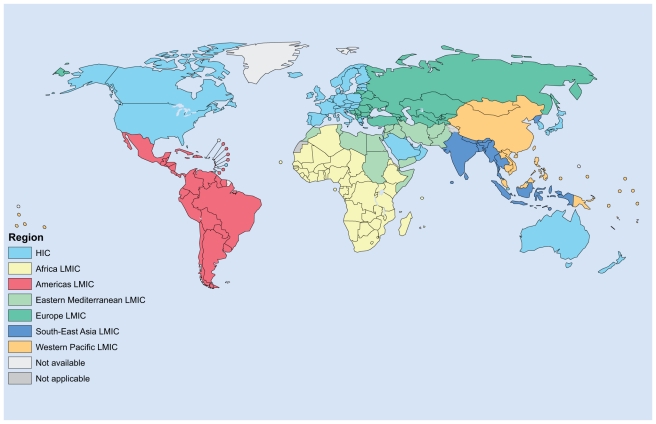
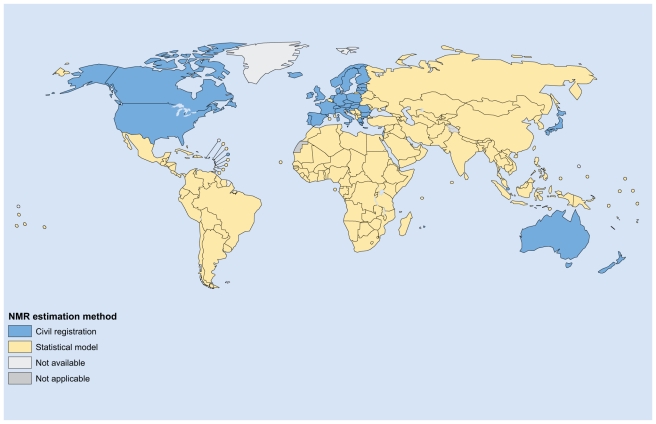
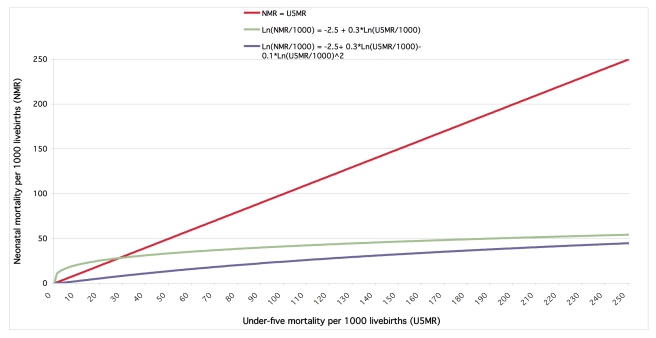
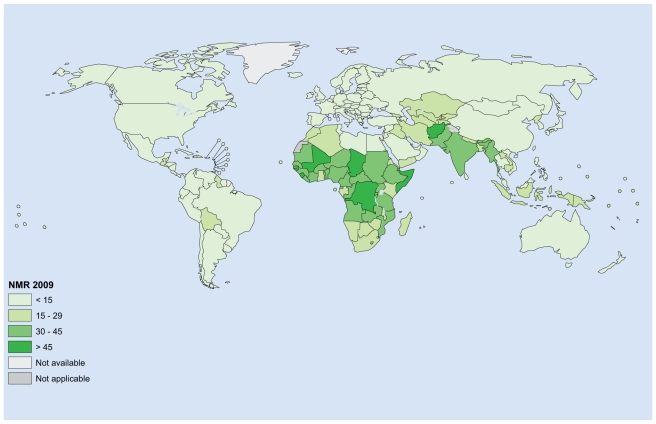
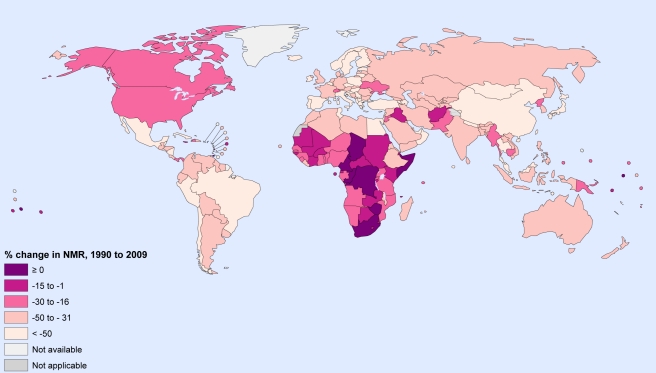
Methods and findings: We compiled a database of mortality in neonates and children (<5 years) comprising 3,551 country-years of information. Reliable civil registration data from 1990 to 2009 were available for 38 countries. A statistical model was developed to estimate NMRs for the remaining 155 countries, 17 of which had no national data. Country consultation was undertaken to identify data inputs and review estimates. In 2009, an estimated 3.3 million babies died in the first month of life-compared with 4.6 million neonatal deaths in 1990-and more than half of all neonatal deaths occurred in five countries of the world (44% of global livebirths): India 27.8% (19.6% of global livebirths), Nigeria 7.2% (4.5%), Pakistan 6.9% (4.0%), China 6.4% (13.4%), and Democratic Republic of the Congo 4.6% (2.1%). Between 1990 and 2009, the global NMR declined by 28% from 33.2 deaths per 1,000 livebirths to 23.9. The proportion of child deaths that are in the neonatal period increased in all regions of the world, and globally is now 41%. While NMRs were halved in some regions of the world, Africa's NMR only dropped 17.6% (43.6 to 35.9).
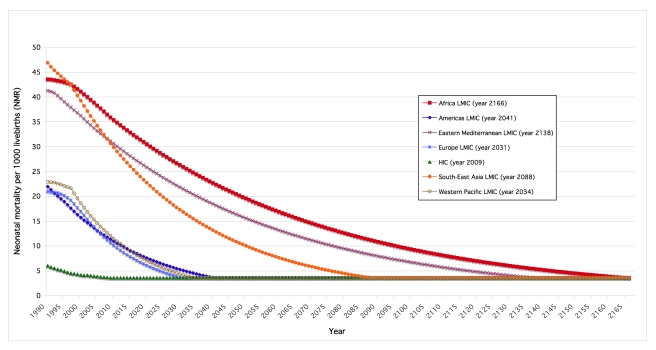
Conclusions: Neonatal mortality has declined in all world regions. Progress has been slowest in the regions with high NMRs. Global health programs need to address neonatal deaths more effectively if Millennium Development Goal 4 (two-thirds reduction in child mortality) is to be achieved.
Conflict of interest statement
The authors have declared that no competing interests exist.
Figures
References
-
- Lawn JE, Cousens S, Zupan J. 4 million neonatal deaths: when? Where? Why? Lancet. 2005;365:891–900. - PubMed
-
- Shiffman J. Issue attention in global health: the case of newborn survival. Lancet. 2010;375:2045–2049. - PubMed
-
- Tinker A, ten Hoope-Bender P, Azfar S, Bustreo F, Bell R. A continuum of care to save newborn lives. Lancet. 2005;365:822–825. - PubMed
-
- Black RE, Cousens S, Johnson HL, Lawn JE, Rudan I, et al. Global, regional, and national causes of child mortality in 2008: a systematic analysis. Lancet. 2010;375:1969–1987. - PubMed
-
- Zupan J, Aahman E. Perinatal mortality for the year 2000: estimates developed by the WHO. Geneva: WHO; 2005.
Publication types
MeSH terms
LinkOut - more resources
Full Text Sources
Other Literature Sources
