Review
. 2011 Oct;24(8):958-72.
doi: 10.1002/nbm.1761. Epub 2011 Aug 23.

State of the art direct 13C and indirect 1H-[13C] NMR spectroscopy in vivo. A practical guide

Affiliations
Review

State of the art direct 13C and indirect 1H-[13C] NMR spectroscopy in vivo. A practical guide

Robin A de Graaf et al. NMR Biomed. 2011 Oct.

Abstract

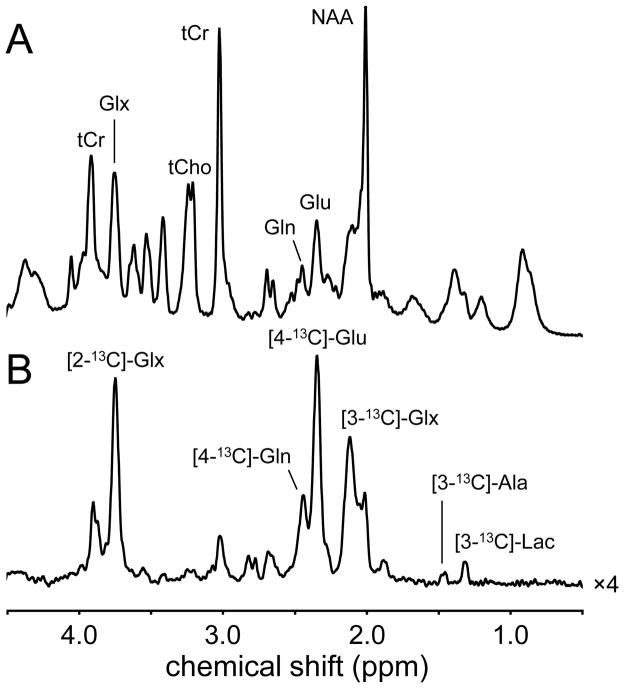
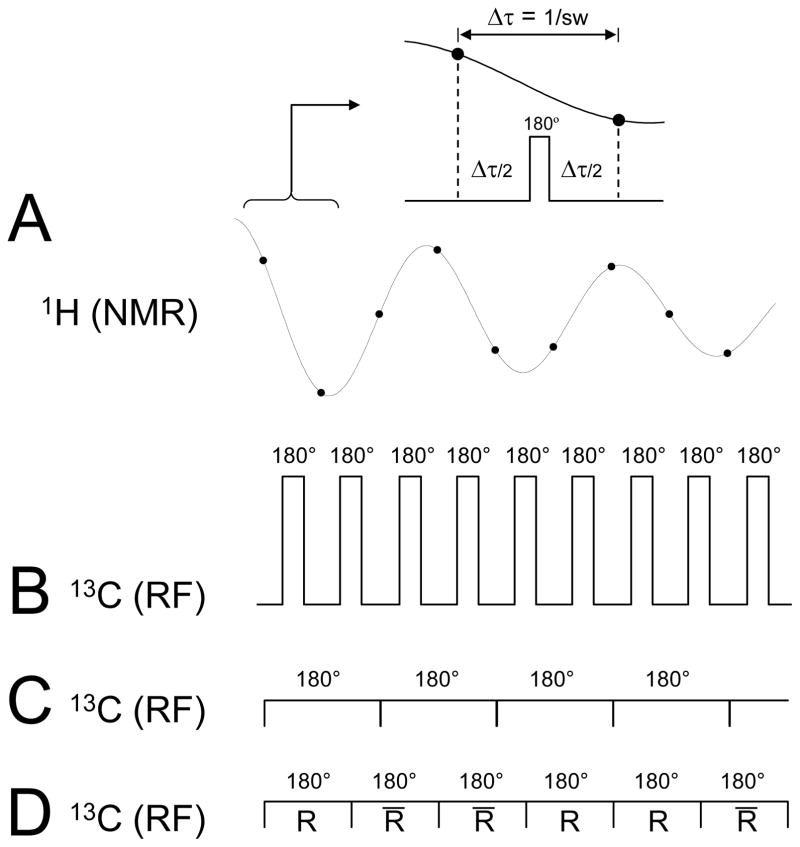
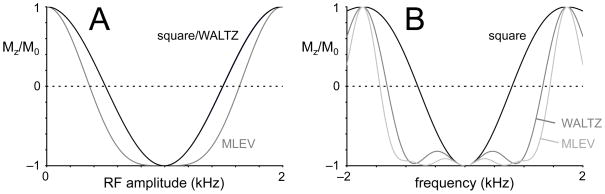
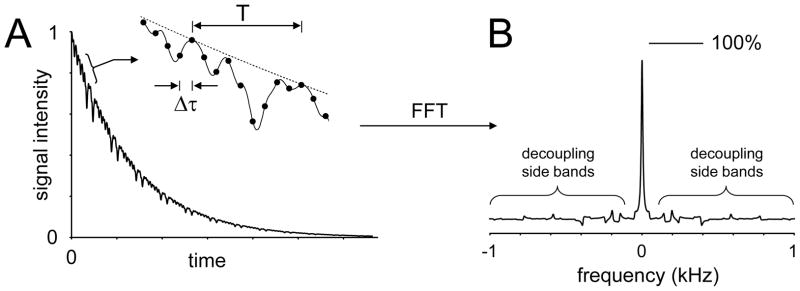
Carbon-13 NMR spectroscopy in combination with (13)C-labeled substrate infusion is a powerful technique for measuring a large number of metabolic fluxes noninvasively in vivo. It has been used to quantify glycogen synthesis rates, establish quantitative relationships between energy metabolism and neurotransmission, and evaluate the importance of different substrates. Measurements can, in principle, be performed through direct (13)C NMR detection or via indirect (1)H-[(13)C] NMR detection of the protons attached to (13)C nuclei. The choice of detection scheme and pulse sequence depends on the magnetic field strength, whereas substrate selection depends on metabolic pathways. (13)C NMR spectroscopy remains a challenging technique that requires several nonstandard hardware modifications, infusion of (13)C-labeled substrates, and sophisticated processing and metabolic modeling. In this study, the various aspects of direct (13)C and indirect (1)H-[(13)C] NMR are reviewed with the aim of providing a practical guide.


Figures

Figure 1
Figure 1
RF coil setup for direct 13C-[1H] NMR on human brain. The 13C RF coil is a single loop surface coil. The two circular 1H RF coils are positioned at a 90° angle and driven in quadrature for improved B2 efficiency. The indicated box is a typical volume size for direct 13C NMR detection.
Figure 2
Figure 2
Filter, amplifier and RF coil setup for indirect 1H-[13C] NMR. A 1H stop/13C pass filter is typically placed in the 13C transmit channel at the position of the filter plate (i.e. the Faraday shield). An identical filter is often placed closer to the RF coil for improved performance. For 1H-[13C] NMR a 1H pass/13C stop filter is typically required prior to the preamplifier to prevent 13C-to-1H noise amplification. Exact filter placement is system-specific and must be determined empirically.
Figure 3
Figure 3
Four-compartment metabolic model compromising the blood, glutamatergic neurons, GABAergic neurons and astroglia. Glucose enters the brain with the aid of glucose transporter in the blood-brain barrier. In the glycolytic pathway, glucose is broken down into two pyruvate molecules which enter the tricarboxylic acid (TCA) cycle. Acetate only enters the astroglial compartment and enters the TCA cycle via acetyl-CoA. One of the TCA cycle intermediates, 2-oxoglutarate, is in rapid exchange with a large glutamate pool that can be observed with NMR. The TCA cycle flux can be obtained from the glutamate turnover and is denoted VTCA. Due to compartmental localization of specific enzymes, the fate of glutamate differs in each of the three cellular compartments. In glutamatergic neurons, glutamate acts as an excitatory neurotransmitter and is released into the synaptic cleft in response to an action potential. Following interaction with post-synaptic receptors, the glutamate is taken up by the astroglia and converted to glutamine. Glutamine is ultimately transported back to the glutamatergic neuron, where it is converted back to glutamate, thereby completing the so-called glutamate-glutamine neurotransmitter cycle. The flux through this cycle, Vcycle, Glu/Gln, can be obtained by following the glutamine turnover. In the GABAergic neuron, the glutamate is first converted to GABA which is the primary inhibitory neurotransmitter. Similar to the glutamatergic neuron, a GABA-glutamine neurotransmitter exists between GABAergic neurons and astroglia. A metabolic pathway specific to astroglia is the carboxylation of pyruvate catalyzed by the astroglia-specific enzyme pyruvate carboxylase. Note that the letter size roughly corresponds to the metabolic pool size of the corresponding metabolite (e.g. a large glutamine pool resides in astroglia). Metabolite abbreviations are given for: Ace, acetate; GABA, γ-aminobutyric acid; Glc, glucose; Gln, glutamine; Glu, glutamate
Figure 4
Figure 4
(A) 1H-decoupled, 13C NMR spectrum of rat brain in vivo obtained with polarization transfer between 120 and 150 min following the onset of intravenous infusion of [1,6-13C2]-glucose. Besides the singlet resonances, the 13C NMR spectrum is (B) characterized by doublet and triplet resonances arising from isotopomers. In particular glutamate and glutamine exhibit several isotopomers of which the C3-C4 combination is most abundant.
Figure 5
Figure 5
(A) Infusion protocol for intravenous administration of a 0.75 M glucose solution in order to raise the blood glucose level to circa 10 mM in an adult rat. (B) In vitro 1H NMR spectrum of unfiltered blood plasma obtained 90 min after the onset of [1,6-13C2]-glucose infusion. The αH1-glucose resonance at 5.22 ppm is readily observable, together with the two satellites for [1-13C]-αH1-glucose. The 13C fractional enrichment for this sample was determined at 43%. (C) Measured blood glucose concentration (black line) and 13C fractional enrichment (gray line) in an adult rat (200 gram) during the infusion protocol shown in (A).
Figure 6
Figure 6
(A) Energy level diagram and thermal equilibrium populations for a heteronuclear scalar-coupled two-spin-system. Closed and open circles represent a relative abundance and shortage of nuclear spins. The spin populations at thermal equilibrium correspond to +½PH + ½PC (αα), +½PH − ½PC (αβ), − ½PH + ½PC (βα) and − ½PH − ½PC (ββ). The difference between spin populations for a given transition determines the spectral intensity, indicated in parentheses. (B) Following an inversion of proton transition (αα ↔ βα), the intensities of the carbon-13 transition redistribute to {PH + PC} and {−PH + PC} thereby leading to an enhancement of ±γH/γC. Vector diagrams of the 1H and 13C magnetizations at times (C) t = 0, before excitation, (D) t = TE1 = 1/(21JCH) before the second 90° pulse, (E) TE1 after the second 90° pulse and (F) t = TE1 + TE2 are shown. The situation in (F) is achieved after a two-step phase cycle of the second 1H 90° pulse to remove the contribution of directly excited 13C magnetization.
Figure 7
Figure 7
Polarization transfer sequence based on adiabatic AFP and BIR-4 pulses. The acquisition phase should be phase-cycled in concert with the second 1H 90° pulse in order to retain the transferred polarization and cancel the direct 13C magnetization. All RF pulses are executed with BIR-4 waveforms, except for the first 13C and last 1H RF pulses, which are executed as shorter AFP pulses, thereby reducing RF power deposition. WALTZ-16 is often used for broadband decoupling during acquisition.
Figure 8
Figure 8
Proton-observed, carbon-edited J-difference sequence based on 3D LASER localization with adiabatic full passage (AFP) RF pulses. In order to attain the adiabatic nature of the method, an adiabatic broadband decoupling sequence is used during acquisition.
Figure 9
Figure 9
(A) 1H and (B) 1H-[13C] NMR spectra acquired from rat brain at 9.4 T in the presence of adiabatic broadband decoupling. The spectra are acquired circa 90 min following the start of [1,6-13C2]-glucose infusion. Similar to the direct 13C NMR spectrum of Fig. 4, the [4-13C]-glutamate resonance is the most intense, reflecting the cerebral TCA cycle activity.
Figure 10
Figure 10
Principle of heteronuclear decoupling during 1H-[13C]-NMR. (A) A continuous 1H time domain signal is sampled at discrete points separated by the dwell-time Δ τ. (B) The application of short 180° pulses on the 13C channel in the middle of each dwell-time would lead to complete refocusing of heteronuclear scalar coupling evolution at each data acquisition point and to perfect decoupling. (C) RF power restrictions necessitate lengthening of the 180° 13C RF pulses over several dwell times, which would lead in the extreme case to continuous wave decoupling. (D) In order to improve the off-resonance performance, the regular 180° pulses are typically substituted with pulse combinations, composite or adiabatic RF pulses (denoted R, where the overbar represents a 180° phase inversion) and combined to form so-called decoupling super cycles.
Figure 11
Figure 11
(A) RF amplitude and (B) frequency dependence of square, MLEV and WALTZ inversion pulses. The RF amplitude of square and WALTZ pulses are identical, whereas MLEV pulses have a decreased sensitivity towards the RF amplitude for inversions. The off-resonance performance of both MLEV and WALTZ pulses is significantly better than that of a square pulse.
Figure 12
Figure 12
Time and frequency domain features of broadband decoupling. (A) In most realistic cases the length of the decoupling RF pulses span several dwell times Δ τ, such that the effects of heteronuclear scalar coupling evolution are not refocused until the end of the pulse. As a result part of the scalar coupling evolution is captured by the data acquisition points covering the length of the RF pulse. (B) These small modulations give rise to so-called decoupling or modulation side bands following Fourier transformation, potentially obscuring other, smaller resonances. The decoupling sidebands necessarily also lead to a reduction in the peak height of the main decoupled resonance (100% represents the maximum intensity in the case of perfect on-resonance CW decoupling).
Figure 13
Figure 13
13C NMR spectra of [4-13C]-glutamate and [3,4-13C2]-glutamate in (A) the presence and (B) the absence of broadband decoupling. 1H decoupling in (A) removed all splitting except the 13C-13C isotopomer splitting. In the absence of decoupling the 13C NMR spectrum becomes much more complicated with many low-intensity resonances, but can still be quantitatively described if all scalar coupling constants are known.
Figure 14
Figure 14
(A) Time resolved 1H-decoupled, 13C NMR spectra from rat brain in vivo following the intravenous infusion of [1,6-13C2]-glucose. Spectra are acquired with an adiabatic INEPT sequence (TR = 4000 ms, 200 uL) at 7.05 T. (B) Turnover curves of [4-13C]-glutamate and [4-13C]-glutamine. Dots represent measured fractional enrichments as obtained through spectral quantification of the data shown in (A), whereas the solid line represents the best mathematical fit to a three-compartment (blood, glutamatergic neurons and astroglia) metabolic model.

References

    1. Siesjo B. Brain energy metabolism. John Wiley; New York: 1978.
    1. Raichle ME, Larson KB, Phelps ME, Grubb RL, Jr, Welch MJ, Ter-Pogossian MM. In vivo measurement of brain glucose transport and metabolism employing glucose-11C. Am J Physiol. 1975;228:1936–1948. - PubMed
    1. Sokoloff L, Reivich M, Kennedy C, Des Rosiers MH, Patlak CS, Pettigrew KD, Sakurada O, Shinohara M. The [14C]deoxyglucose method for the measurement of local cerebral glucose utilization: theory, procedure, and normal values in the conscious and anesthetized albino rat. J Neurochem. 1977;28:897–916. - PubMed
    1. Phelps ME, Huang SC, Hoffman EJ, Selin C, Sokoloff L, Kuhl DE. Tomographic measurement of local cerebral glucose metabolic rate in humans with 18F-2-fluoro-2-deoxy-D-glucose: validation of method. Ann Neurol. 1979;6:371–388. - PubMed
    1. Reivich M, Kuhl D, Wolf A, Greenberg J, Phelps M, Ido T, Casella V, Fowler J, Hoffman E, Alavi A, Som P, Sokoloff L. The [18F]fluorodeoxyglucose method for the measurement of local cerebral glucose utilization in man. Circ Res. 1979;44:127–137. - PubMed

Publication types

LinkOut - more resources