

MELD Exceptions and Rates of Waiting List Outcomes
- PMID: 21920019
- PMCID: PMC3229963
- DOI: 10.1111/j.1600-6143.2011.03735.x
MELD Exceptions and Rates of Waiting List Outcomes
Abstract
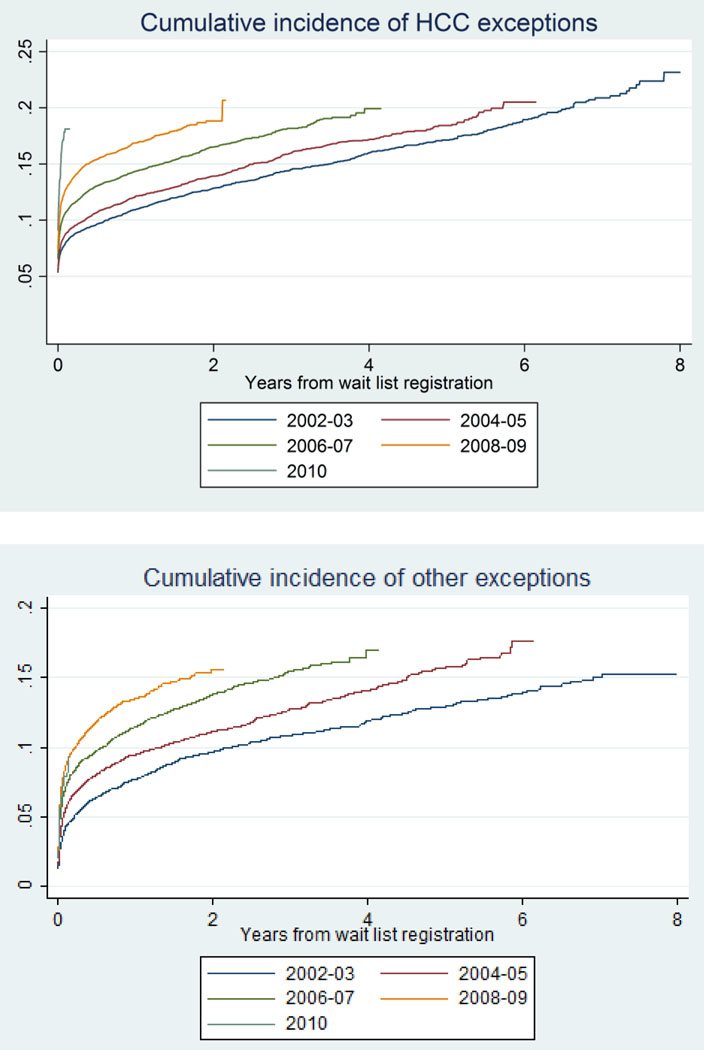
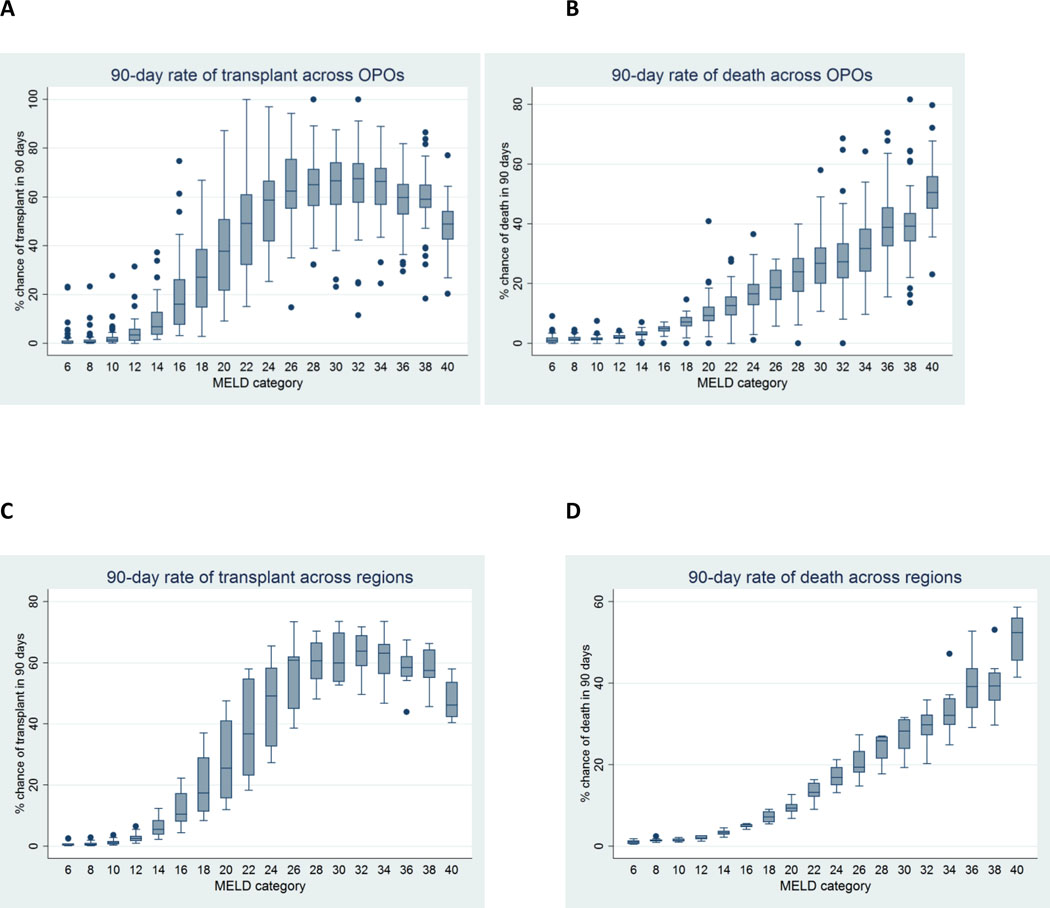
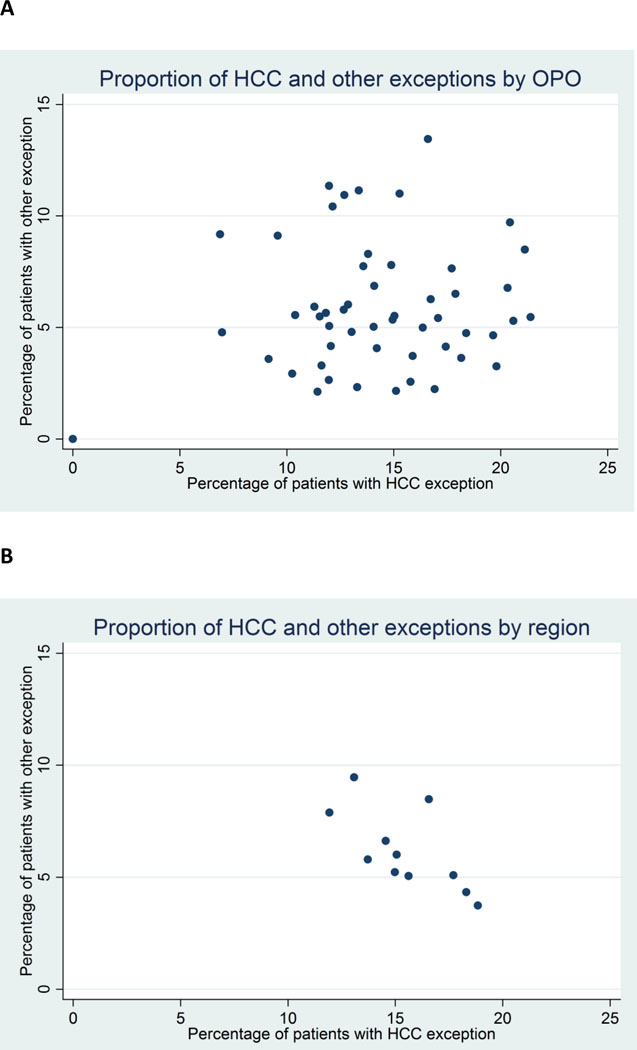
Model for End-stage Liver Disease (MELD)-based allocation of deceased donor livers allows exceptions for patients whose score may not reflect their true mortality risk. We hypothesized that organ procurement organizations (OPOs) may differ in exception practices, use of exceptions may be increasing over time, and exception patients may be advantaged relative to other patients. We analyzed longitudinal MELD score, exception and outcome in 88 981 adult liver candidates as reported to the United Network for Organ Sharing from 2002 to 2010. Proportion of patients receiving an HCC exception was 0-21.4% at the OPO-level and 11.9-18.8% at the region level; proportion receiving an exception for other conditions was 0.0%-13.1% (OPO-level) and 3.7-9.5 (region-level). Hepatocellular carcinoma (HCC) exceptions rose over time (10.5% in 2002 vs. 15.5% in 2008, HR = 1.09 per year, p<0.001) as did other exceptions (7.0% in 2002 vs. 13.5% in 2008, HR = 1.11, p<0.001). In the most recent era of HCC point assignment (since April 2005), both HCC and other exceptions were associated with decreased risk of waitlist mortality compared to nonexception patients with equivalent listing priority (multinomial logistic regression odds ratio [OR] = 0.47 for HCC, OR = 0.43 for other, p<0.001) and increased odds of transplant (OR = 1.65 for HCC, OR = 1.33 for other, p<0.001). Policy advantages patients with MELD exceptions; differing rates of exceptions by OPO may create, or reflect, geographic inequity.
©2011 The Authors Journal compilation © 2011 The American Society of Transplantation and the American Society of Transplant Surgeons.
Figures
Comment in
-
Variation in health care delivery: the example of exception awards in liver transplantation.Am J Transplant. 2011 Nov;11(11):2271-2. doi: 10.1111/j.1600-6143.2011.03740.x. Epub 2011 Sep 15. Am J Transplant. 2011. PMID: 21920022 No abstract available.
References
-
- Kamath PS, Wiesner RH, Malinchoc M, Kremers W, Therneau TM, Kosberg CL, et al. A model to predict survival in patients with end-stage liver disease. Hepatology. 2001;33(2):464–470. - PubMed
-
- Voigt MD, Zimmerman B, Katz DA, Rayhill SC. New national liver transplant allocation policy: is the regional review board process fair? Liver transplantation : official publication of the American Association for the Study of Liver Diseases and the International Liver Transplantation Society. 2004;10(5):666–674. - PubMed
-
- Freeman RB, Jr, Gish RG, Harper A, Davis GL, Vierling J, Lieblein L, et al. Model for end-stage liver disease (MELD) exception guidelines: results and recommendations from the MELD Exception Study Group and Conference (MESSAGE) for the approval of patients who need liver transplantation with diseases not considered by the standard MELD formula. Liver transplantation : official publication of the American Association for the Study of Liver Diseases and the International Liver Transplantation Society. 2006;12(12) Suppl 3:S128–S136. - PubMed
-
- Rodriguez-Luna H, Vargas HE, Moss A, Reddy KS, Freeman RB, Mulligan D. Regional variations in peer reviewed liver allocation under the MELD system. American journal of transplantation : official journal of the American Society of Transplantation and the American Society of Transplant Surgeons. 2005;5(9):2244–2247. - PubMed
-
- Wiesner R, Lake JR, Freeman RB, Gish RG. Model for end-stage liver disease (MELD) exception guidelines. Liver transplantation : official publication of the American Association for the Study of Liver Diseases and the International Liver Transplantation Society. 2006;12(12) Suppl 3:S85–S87. - PubMed
Publication types
MeSH terms
Grants and funding
LinkOut - more resources
Full Text Sources
Medical
Miscellaneous
