. 2011 Dec 1;360(1):230-40.
doi: 10.1016/j.ydbio.2011.08.016. Epub 2011 Sep 3.

Gene length may contribute to graded transcriptional responses in the Drosophila embryo

Affiliations

Gene length may contribute to graded transcriptional responses in the Drosophila embryo

Peter McHale et al. Dev Biol. .

Abstract

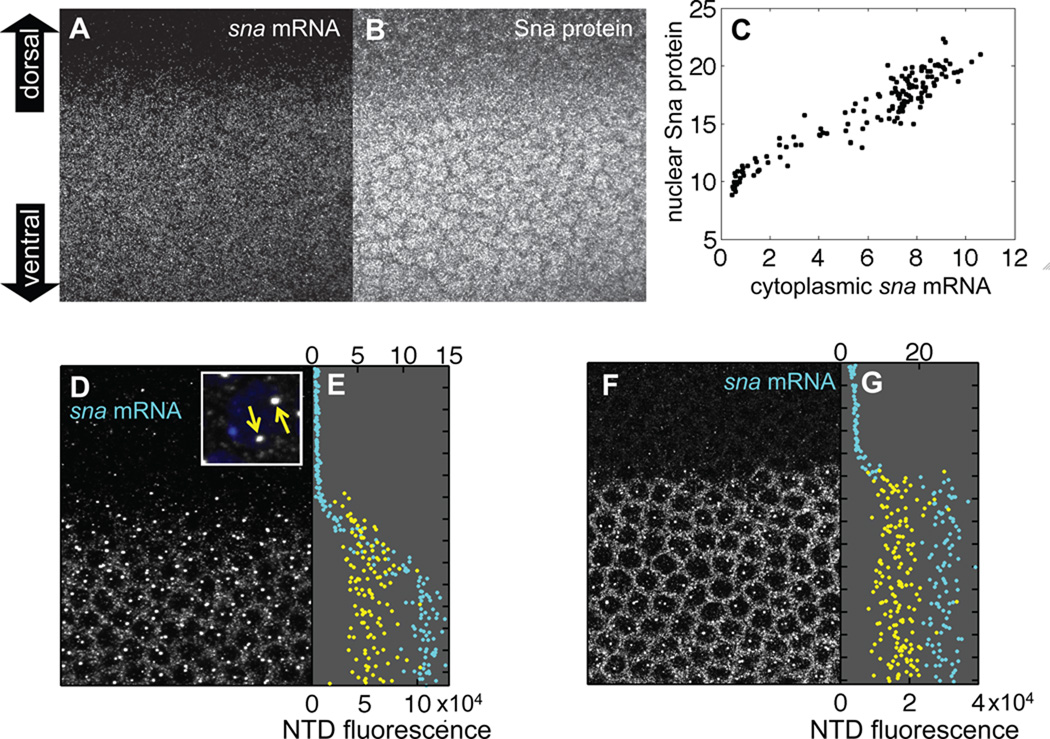
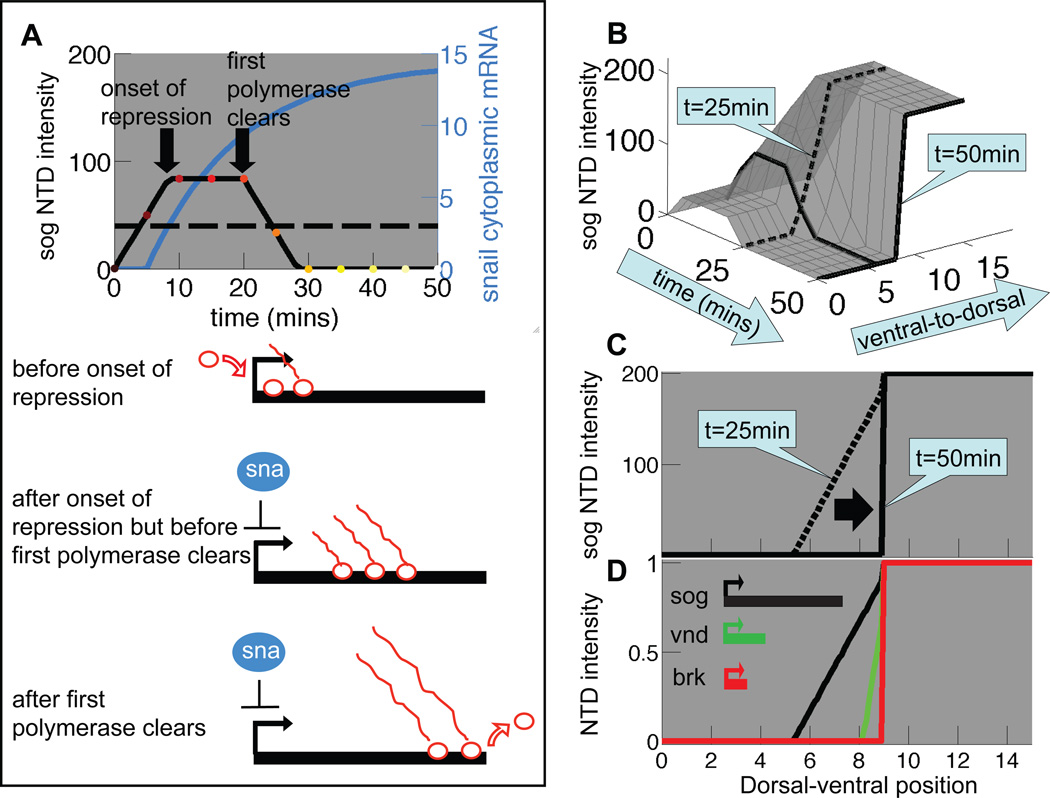
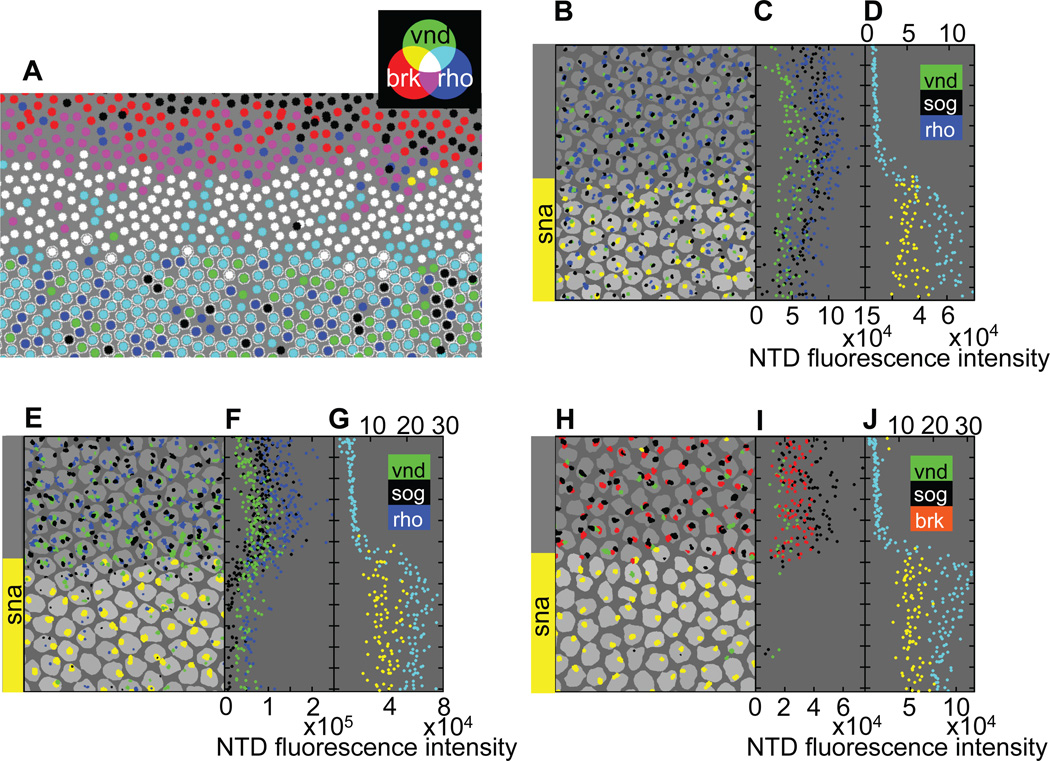
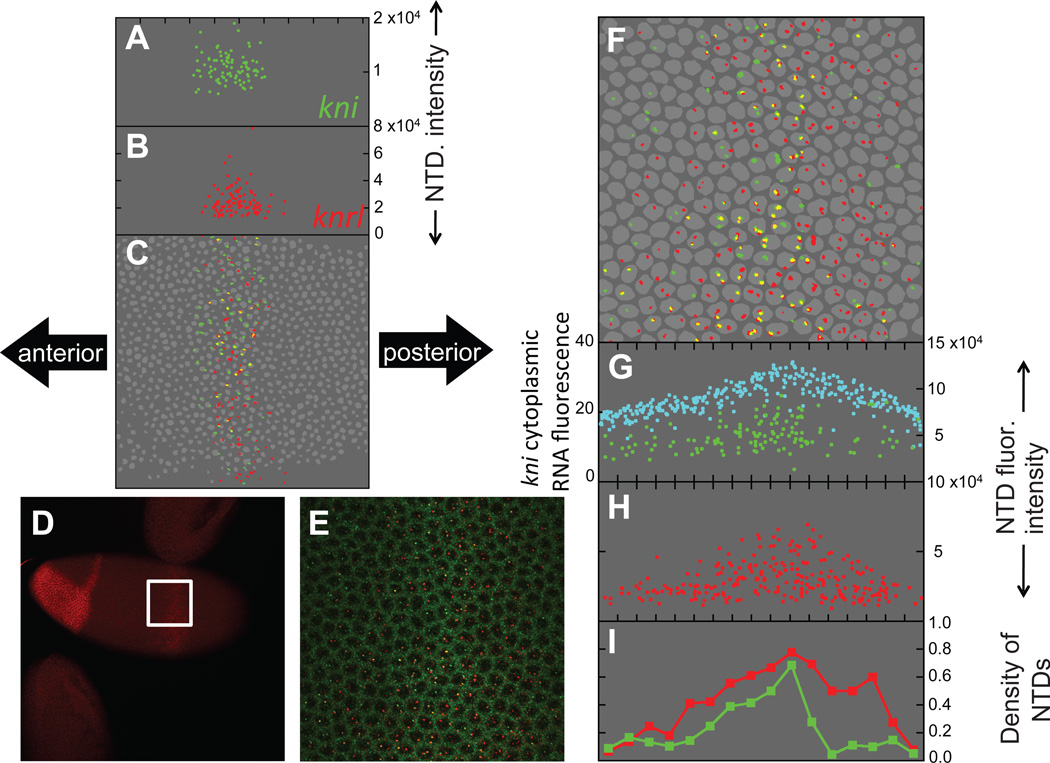
An important question in developmental biology is how relatively shallow gradients of morphogens can reliably establish a series of distinct transcriptional readouts. Current models emphasize interactions between transcription factors binding in distinct modes to cis-acting sequences of target genes. Another recent idea is that the cis-acting interactions may amplify preexisting biases or prepatterns to establish robust transcriptional responses. In this study, we examine the possible contribution of one such source of prepattern, namely gene length. We developed quantitative imaging tools to measure gene expression levels for several loci at a time on a single-cell basis and applied these quantitative imaging tools to dissect the establishment of a gene expression border separating the mesoderm and neuroectoderm in the early Drosophila embryo. We first characterized the formation of a transient ventral-to-dorsal gradient of the Snail (Sna) repressor and then examined the relationship between this gradient and repression of neural target genes in the mesoderm. We found that neural genes are repressed in a nested pattern within a zone of the mesoderm abutting the neuroectoderm, where Sna levels are graded. While several factors may contribute to the transient graded response to the Sna gradient, our analysis suggests that gene length may play an important, albeit transient, role in establishing these distinct transcriptional responses. One prediction of the gene-length-dependent transcriptional patterning model is that the co-regulated genes knirps (a short gene) and knirps-related (a long gene) should be transiently expressed in domains of differing widths, which we confirmed experimentally. These findings suggest that gene length may contribute to establishing graded responses to morphogen gradients by providing transient prepatterns that are subsequently amplified and stabilized by traditional cis-regulatory interactions.


Figures

Figure 1
Figure 1. Quantification of a transient sna gradient
(A) Early nuclear cycle 14 embryo stained for sna mRNA via Fluorescent In Situ Hybridization. The sna mRNA fluorescence shown in the image is a maximum projection of a confocal stack spanning the apical cytoplasm where sna cytoplasmic mRNA is localized. Embryo is oriented with ventral side downwards. Anterior is to the left and posterior is to the right. (B) Same embryo co-stained for Sna protein. The image is a maximum projection of a confocal stack spanning the apical-basal extent of the nuclei. The fluorescence has been amplified by a factor of 4 to better visualize the nuclear localization of Sna protein, but the original unamplified data was used in our analysis. (C) Sna protein in individual nuclei is linearly correlated with sna cytoplasmic mRNA. The signals represent voxel intensities averaged over nuclear segmentations and cytoplasmic Voronoi cellular reconstructions. Data was taken from the individual embryo shown in panels A, B. (D) Another early cycle 14 embryo stained for sna mRNA representing a confocal stack spanning the nuclei. Cytoplasmic mRNA stains in a dorsal-ventral gradient (raw data amplified by factor 2.5 to make gradient more apparent in this panel but unamplified data used in subsequent analysis). Two strong foci of sna mRNA fluorescence intensity (referred to as NTDs in the main text) are visible in most nuclei in the presumptive mesoderm (lower half of panel). Inset shows a high-magnification image of two NTDs (yellow arrows) in a single nucleus (indicated by DAPI staining in blue). (E) sna NTD dorsal-ventral profile, corresponding to the single embryo shown in (D), is plotted in yellow with NTD intensities corresponding to the bottom axis. Dorsal-ventral position of the center of mass of each nucleus is plotted in cyan against the mean fluorescence intensity per voxel of sna mRNA in the associated cytoplasm (quantification of fluorescence intensity is indicated on the top axis). (F, G) Same as (D, E) except that data was acquired from a single embryo in the late cellularization stage of nuclear cycle 14. Again sna mRNA signal is amplified (by a factor of 2) in panel F but not in panel G. Notice the much sharper profile of sna mRNA intensity compared to that in panels D, E.
Figure 2
Figure 2. Neuroectodermal genes are differentially repressed in the mesoderm
(A) Reconstruction of a low-magnification in situ hybridization confocal stack taken from an individual embryo, imaged at early-mid cycle 14, showing expression of three neuroectodermal genes (brk, vnd, and rho) and the mesodermal transcriptional repressor sna. The circles represent nuclei and the colors indicate the combination of Nuclear Transcription Dots (NTDs) detected for the various neuroectodermal genes. Black indicates that no neuroectodermal NTDs were detected. A circle circumscribed by a white outline indicates a nucleus in which a sna NTD was detected. (B) Reconstruction of the individual embryo shown in Fig. 1D with the same dorsal-ventral and anterior-posterior orientation. The area of each NTD is proportional to the projected area of the 3D NTD from which it is reconstructed, but the projected areas are magnified by a fixed factor to aid visualization. Also shown is a single optical section through the set of 3D nuclear segmentations, where the shading of the nuclear masks is proportional to the mean voxel intensity of sna cytoplasmic mRNA in the corresponding Voronoi cells surrounding each nucleus (see Supporting Text). Notice the jagged but sharp sna NTD border. (C) The dorsal-ventral position of each NTD shown in (B) is plotted against the integrated fluorescence intensity of the NTD. Tick marks represent average nuclear spacing. Raw spatial profiles are uncorrected for background, variations in number of fluorophores associated with a target mRNA, or fluorophore efficiency. (D) sna NTD and cytoplasmic mRNA dorsal-ventral profile are reproduced from Fig. 1E for direct comparison with neuroectodermal gene expression. (E) Same format as panel B, but for an individual embryo in late cellularization stage of cycle 14 stained for brk instead of rho. Notice that an on/off border separates the sna and neuroectodermal gene expression domains, which are virtually mutually exclusive at this stage and that the sna expression border defined by sna NTDs is straight in contrast to the jagged, but equally sharp, NTD border present in earlier embryos (e.g., compare the meandering yellow border of reconstructed sna NTDs in this panel to the straight border evident in panel B). (F, G) Same format as panels C and D.
Figure 3
Figure 3. Differences in neuroectodermal gene length yield a stratified pattern of neuroectodermal nascent gene expression in a delayed-repression model
(A) Time course of sog NTD intensity (black line) in a mesodermal nucleus as calculated in the delayed-repression model (Eq. S3), using as input the sna cytoplasmic mRNA levels (blue line) calculated in the expansion-accumulation model (Eq. S2). The horizontal dashed line indicates the threshold concentration for sna repression (K = 3; see Eq. S5). The delay in repression arising from the length of the sog gene is assumed to be τ = 20 min. (Eq. S4). (B) sog NTD time courses for various nuclei can be combined to construct a surface describing the spatiotemporal dependence of sog NTD intensity. The black line corresponds to the temporal profile analyzed in (A). Spatial profiles at early (t=25 min.) and late (t=50 min.) cellular blastoderm are indicated. (C) Slices taken from the surface in (B) at early (t=25 min.) and late (t=50 min.) stages reveal a transient spatial gradient of sog NTD intensity. (D) The delayed-repression model (Eq. S3) predicts that transient nested gradients of sog, vnd and brk NTD intensity, similar to those observed experimentally (Fig. 2C), occur in early cycle 14 (t=25 min.) due solely to differences in neuroectodermal gene length. Transcriptional delays are assumed to be τ = 20 min. (sog), 6 min. (vnd) and 2 min. (brk), corresponding respectively to gene lengths of 22 kb (sog), 7 kb (vnd), and 3 kb (brk). These estimated gene lengths are based on RNA-seq data available through the modEncode Drosophila genome browser located at http://modencode.oicr.on.ca/fgb2/gbrowse/fly/ and on ChIP-chip polymerase-II binding data in early embryos ((Zeitlinger et al., 2007a); see also Fig. S2 of Ref (Boettiger and Levine, 2009)). Note that vnd has an alternate remote upstream promoter but the modEncode RNA-seq data indicate that this is not used until later in embryogenesis. The transcription initiation rate was chosen to be αon = 10 per min (same for all neuroectodermal genes), though its actual value does not affect our conclusions (αon is defined in Eq. S5).
Figure 4
Figure 4. Widespread ectopic neuroectodermal gene expression in sna−/+ heterozygous embryos illustrates the haploinsufficiency of sna
(A) Reconstruction of an individual sna−/+ embryo in early-mid cellularization stage of cycle 14 (same format as Fig. 2A). There is widespread mis-expression of vnd and rho in the mesoderm; in contrast brk is completely excluded from the mesoderm as in wild-type embryos. (B–D) Reconstructed image of a single early cycle 14 embryo, similar to Fig. 2B–D. Note that mesodermal nuclei contain only one NTD of sna each, confirming that the embryo is a sna−/+ heterozygote. (E–G) Mid-cellularization-stage cycle 14 embryo. (H–J) Late cellularization-stage cycle-14 embryo.
Figure 5
Figure 5. The dynamic expression patterns of kni and knrl constitute a natural test of the gene-length hypothesis
(A–C) Reconstruction (similar to Figs. 2 and 4) of an early-blastoderm-stage embryo with the field of view spanning the central kni/knrl stripe. Anterior is to the left, posterior to the right, ventral is down and dorsal is up. (D) Mid-blastoderm stage embryo stained for knrl mRNA (red) showing expression in an anterior patch and a central stripe. A higher magnification confocal stack (white square) spanning the central stripe was acquired and analyzed in (E–I). (E) Maximum projection of the central kni/knrl stripe stained for kni mRNA (green) and knrl mRNA (red). Image corresponds to the white square shown in (D). (F–H) Reconstruction of the embryo in (D) and (E). In (G), kni cytoplasmic mRNA fluorescence (cyan) is plotted on the left axis whereas kni NTD fluorescence intensity (green) is plotted on the right axis. (I) Anterior-posterior profile of NTD density. For each gene, we quantitated the spatial density of NTDs along the dorsal-ventral axis by binning the anterior-posterior axis, calculating the number of NTDs in each bin, and then normalizing by twice the number of nuclei in the corresponding bin (the factor of two arises because each gene exists in two copies in each nucleus).
Figure 6
Figure 6. Target genes of the Dl, BMP, and Hh morphogens generally follow the A/R rule
(A) Relative positions of dorsal-most expression borders of dorsal target genes, together with their genomic length (in kb), are shown schematically on the left of the embryo. Relative positions of ventral-most expression borders of sna target genes, together with their genomic length (in kb), are shown on the right of the embryo. The arrows on the morphogen gradients indicate the hypothesized direction of gradient movement in the region of the embryo where the target genes are expressed. (B) Relative border positions of dpp targets genes in the dorsal epidermis (left) and relative dorsal-most borders of dpp targets in the neuroectoderm (right) of the embryo. Also shown are the oppositely directed gradients of dpp and brk. Genomic length in kb indicated in brackets. (C) Relative extents of gene expression of Dpp target genes in the wing imaginal disc with opposing gradients of Dpp and brk (genomic length in kb indicated in brackets). (D) Relative border positions of Hh target genes in the anterior half of the imaginal wing disc along with the reciprocal gradients of Hh and Ci (genomic length in kb indicated in brackets). In all four panels, there is a general trend, represented by target-gene names in bold type, favoring borders of short genes near the activation (A) pole and borders of longer genes near the repressor (R) pole of the corresponding morphogen gradient.
Figure 7
Figure 7. Mis-expression of Sog versus Brk in the developing mesoderm has divergent effects on developing visceral cells
(A) in situ hybridization for eve, which labels precursor cells of the visceral mesoderm, in a twi-Gal4<UAS-sog E11 embryo. The majority of the visceral mesoderm precursor cells are present (arrowhead), with only a few exceptions (asterisk). (B) anti-Eve protein staining in a twi-Gal4<UAS-brk E11 embryo. Note that most eve+ cells are missing (asterisks). In both cases, expression of eve in the ventral nerve cord is normal. Embryos are oriented with anterior to the left.

References

    1. Bardin AJ, Schweisguth F. Bearded family members inhibit Neuralized-mediated endocytosis and signaling activity of Delta in Drosophila. Dev Cell. 2006;10:245–255. - PubMed
    1. Barolo S, Posakony JW. Three habits of highly effective signaling pathways: principles of transcriptional control by developmental cell signaling. Genes Dev. 2002;16:1167–1181. - PubMed
    1. Boettiger AN, Levine M. Synchronous and stochastic patterns of gene activation in the Drosophila embryo. Science. 2009;325:471–473. - PMC - PubMed
    1. Capovilla M, Eldon E, Pirrotta V. The giant gene of Drosophila encodes a B-ZIP DNA-binding protein that regulates the expression of other segmentation gap genes. Development. 1992;114:99–112. - PubMed
    1. Chitnis AB. Keeping single minded expression on the straight and narrow. Mol Cell. 2006;21:450–452. - PubMed

Publication types

MeSH terms

LinkOut - more resources