. 2012 Jan;24(1):181-8.
doi: 10.1016/j.cellsig.2011.08.021. Epub 2011 Sep 8.

Effect of the ILE86TER mutation in the γ subunit of cGMP phosphodiesterase (PDE6) on rod photoreceptor signaling

Affiliations

Effect of the ILE86TER mutation in the γ subunit of cGMP phosphodiesterase (PDE6) on rod photoreceptor signaling

Stephen H Tsang et al. Cell Signal. 2012 Jan.

Abstract

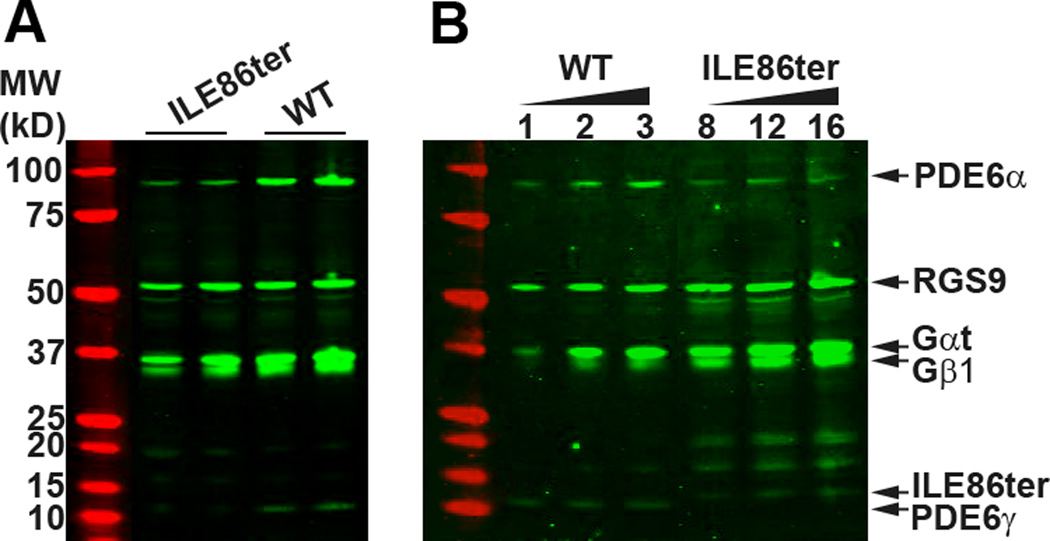
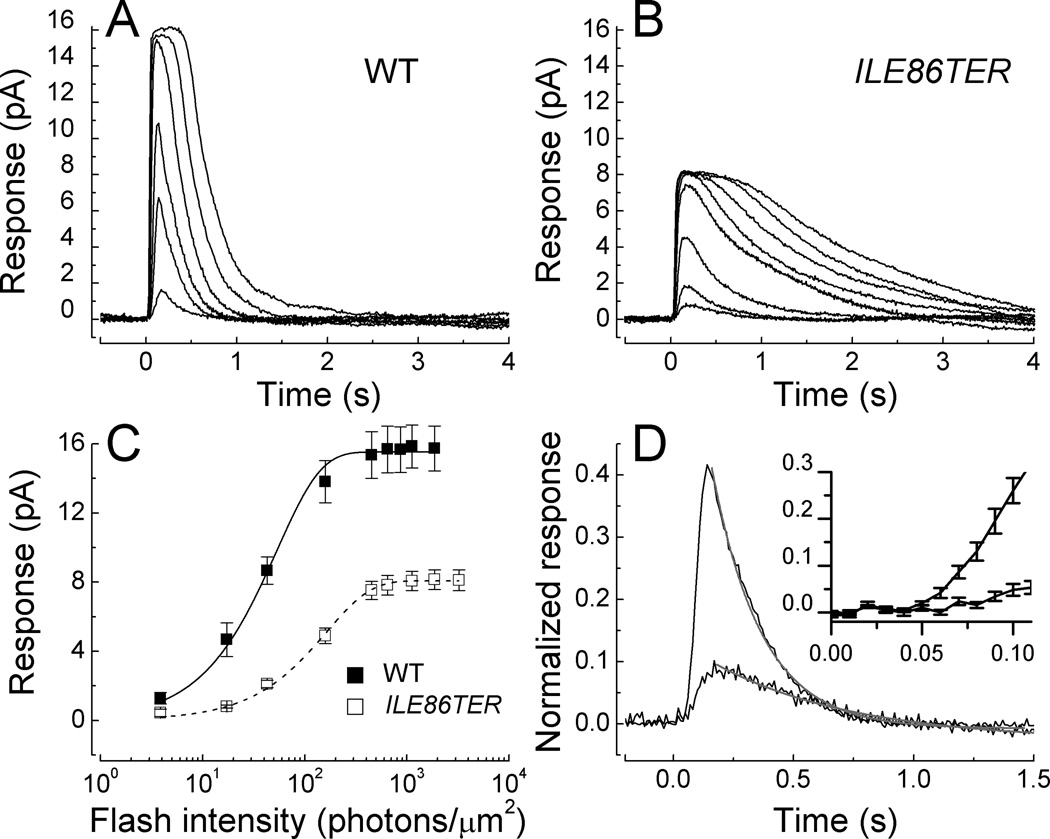
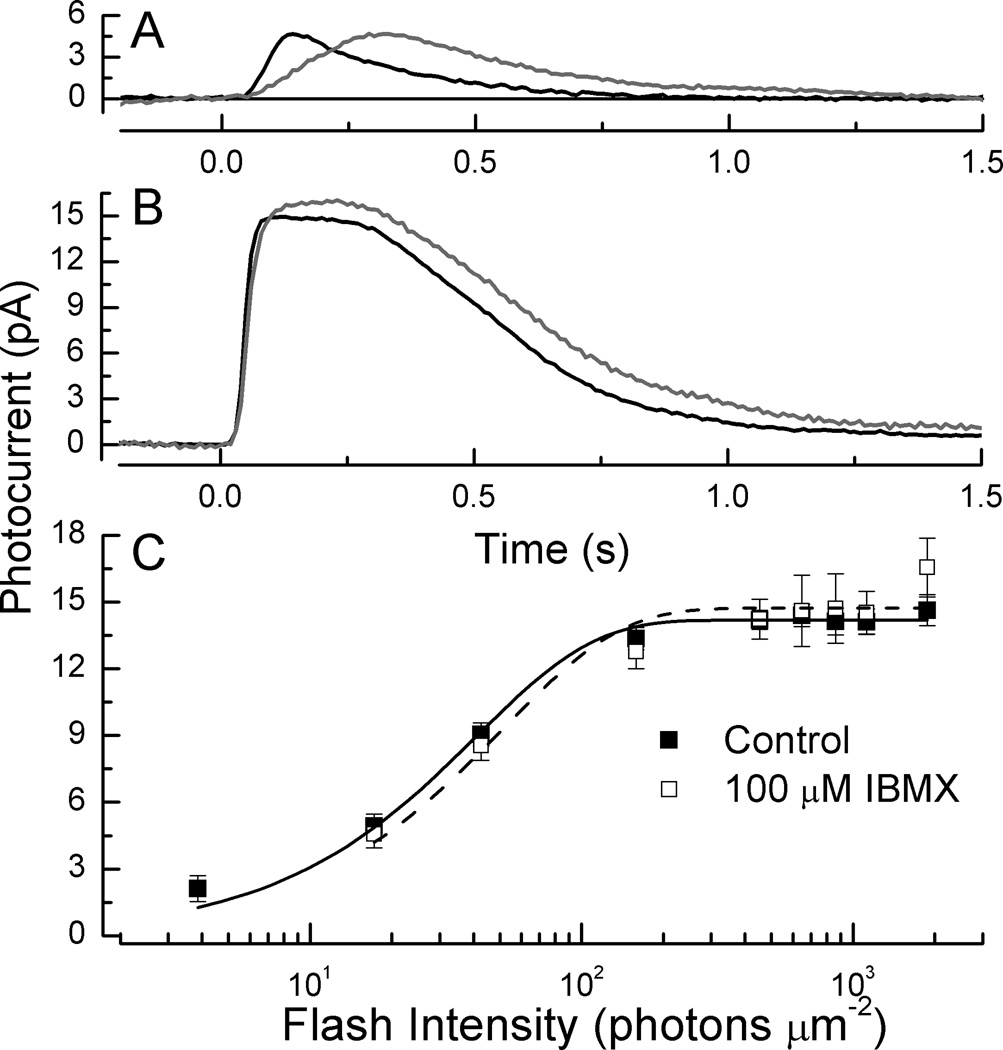
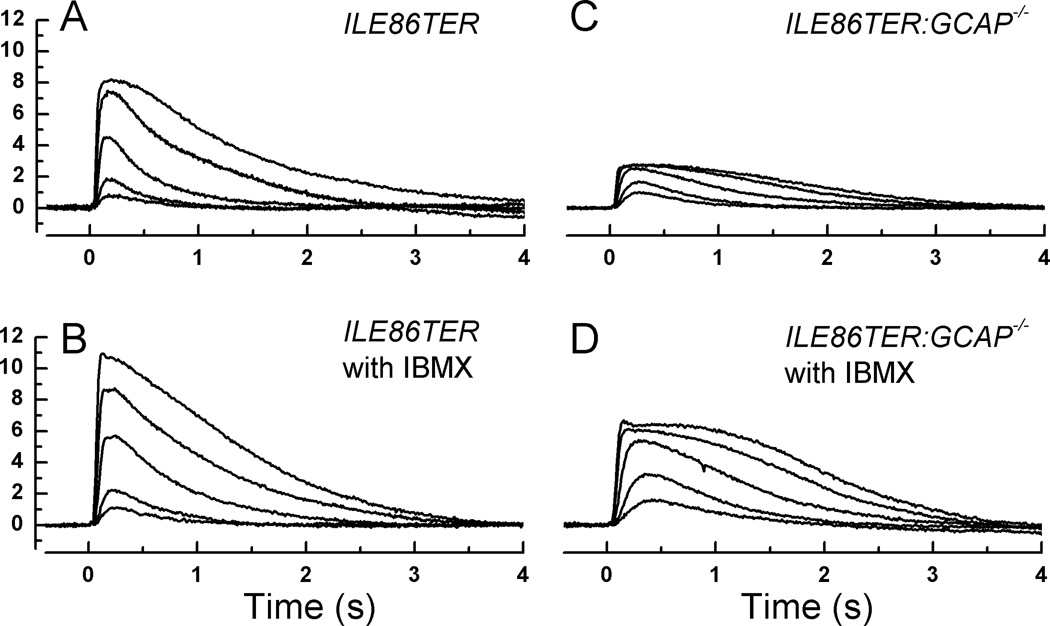
The light-dependent decrease in cyclic guanosine monophosphate (cGMP) in the rod outer segment is produced by a phosphodiesterase (PDE6), consisting of catalytic α and β subunits and two inhibitory γ subunits. The molecular mechanism of PDE6γ regulation of the catalytic subunits is uncertain. To study this mechanism in vivo, we introduced a modified Pde6g gene for PDE6γ into a line of Pde6g(tm1)/Pde6g(tm1) mice that do not express PDE6γ. The resulting ILE86TER mice have a PDE6γ that lacks the two final carboxyl-terminal Ile(86) and Ile(87) residues, a mutation previously shown in vitro to reduce inhibition by PDE6γ. ILE86TER rods showed a decreased sensitivity and rate of activation, probably the result of a decreased level of expression of PDE6 in ILE86TER rods. More importantly, they showed a decreased rate of decay of the photoresponse, consistent with decreased inhibition of PDE6 α and β by PDE6γ. Furthermore, ILE86TER rods had a higher rate of spontaneous activation of PDE6 than WT rods. Circulating current in ILE86TER rods that also lacked both guanylyl cyclase activating proteins (GCAPs) could be increased several fold by perfusion with 100μM of the PDE6 inhibitor 3-isobutyl-1-methylxanthine (IBMX), consistent with a higher rate of dark PDE6 activity in the mutant photoreceptors. In contrast, IBMX had little effect on the circulating current of WT rods, unlike previous results from amphibians. Our results show for the first time that the Ile(86) and Ile(87) residues are necessary for normal inhibition of PDE6 catalytic activity in vivo, and that increased basal activity of PDE can be partially compensated by GCAP-dependent regulation of guanylyl cyclase.


Figures

Fig. 1
Fig. 1. Immunoblot analysis of the expression of PDE and other rod transduction proteins
(A). The levels of RGS9, Gαt and Gβ1 were comparable between WT and ILE86ter retinas. However, PDE6 α and γ subunits were noticeably lowered in the ILE86ter retinas. Equal fraction of a retina (1/50) from an individual mouse was loaded onto each lane. (B). Quantification of PDE expression levels in ILE86ter and WT retinas. Representative blot of retinal extract prepared from WT and ILE86TER/GCAPs−/− mice. Each lane represent the amount loaded (µl) per retina (200 µl total sample volume). Based on the fluorescence signal quantified from each sample, the amount of PDE6α and PDE6γ in ILE86ter was 10 ± 3% of WT (N=3). Control experiments revealed no difference in PDE6 subunit expression levels between ILE86TER and ILE86TER/GCAPs−/− mice. Levels of other transduction proteins (RGS9, Gαt and Gβ1) were similar between WT and ILE86ter.
Fig. 2
Fig. 2. ILE86TER transgene rescues retinal degeneration. Retinal light micrographs
(A). An adult Pde6gtm1/Pde6gtm1 homozygote; (B). Pde6gtm1/Pde6gtm1 homozygote with the ILE86TER transgene; (C). ILE86TER/GCAPs−/− retina; and (D). C57B6 control. OS, outer segments; ONL, outer nuclear layer; INL, inner nuclear layer. The retina of the adult Pde6gtm1/Pde6gtm1 mouse lost all rod photoreceptors, and only a single layer of cones remains. Scale bars, 25 µm.
Fig. 3
Fig. 3. Waveform and amplitude of WT and ILE86TER rods
(A). Mean responses averaged from 10 WT rods to responses of 20 ms flashes of the following intensities (in photons µm−2): 3.9, 17, 43, 159, 453, and 1120. (B). Mean responses averaged from 18 ILE86TER rods to responses of 20 ms flashes of the following intensities (in photons µm2): 17, 43, 159, 453, 646, 1120, 1870, and 3250. (C). Peak amplitude of responses with SE as a function of intensity from 10 WT rods and 18 ILE86TER rods; same rods as in Figs. 3A and 3B. Means have been fitted with the exponential saturation function [46] of the form r = rmax [1 − exp(−kI)] where r is the peak amplitude of the response, rmax is the maximum value of the peak response amplitude at bright flash intensities, I is the flash intensity, and k is a constant. Best-fitting values were k = 0.019 photons−1 µm2 and rmax of 15.5 pA for WT rods, and k = 0.006 photons−1 µm2 and rmax of 8.1 pA for ILE86TER rods. (D). Mean responses from the same rods as in Figs. 3A and 3B to the same flash of intensity 17 photons µm−2. Declining waveforms of responses have been fitted with Equation (1); see text. Insert. Initial time courses of responses (with SE) are given on a faster time base to illustrate much slower rate of rise of ILE86TER response.
Fig. 4
Fig. 4. Effect of IBMX on single WT mouse rods
(A). Mean responses of 9 WT control rods (black) and 9 WT rods from the same retinas exposed to 100 µM IBMX, to flashes given at t = 0 of intensity 17 photons µm−2. (B). Same as in A but for saturating flashes of intensity 450 photons µm−2. (C). Response intensity curves of 9 rods before (■) and during (□) exposure to 100 µM IBMX. Means have been fitted with r = rmax [1 − exp(−kI)] as in Fig. 3D, for WT rods before exposure (continuous curve) with k = 0.0244 photons−1 µm2 and rmax of 14.2 pA, and for WT rods in IBMX (dashed curve) with k = 0.0194 photons−1 µm2 and rmax of 14.7 pA.
Fig. 5
Fig. 5. Effect of IBMX on ILE86TER and ILE86TER/GCAPko rods
A, Mean responses averaged from 18 ILE86TER rods to responses of 20 ms flashes of the following intensities (in photons µm2): 17, 43, 159, 453, and 1120. Same traces as in Fig. 4B. B, Mean responses averaged from 9 ILE86TER rods in presence of 100 µM IBMX to responses of 20 ms flashes of same intensities as in A. C, Mean responses averaged from 14 ILE86TER/GCAP−/− rods to responses of 20 ms flashes of same intensities as in A and B. D, Mean responses averaged from 11 ILE86TER/GCAP−/− rods in presence of 100 µM IBMX to responses of 20 ms flashes of the following intensities (in photons µm2): 17, 43, 159, 453, and 646.

References

    1. Fain GL. Sensory Transduction. Sunderland, MA: Sinauer, Inc.; 2003.
    1. Granovsky AE, Artemyev NO. Biochemistry. 2001;40(44):13209–13215. - PubMed
    1. Lipkin VM, Dumler IL, Muradov KG, Artemyev NO, Etingof RN. FEBS Lett. 1988;234(2):287–290. - PubMed
    1. Artemyev NO, Hamm HE. Biochem J. 1992;283(Pt 1):273–279. - PMC - PubMed
    1. Gonzalez K, Cunnick J, Takemoto D. Biochem Biophys Res Commun. 1991;181(3):1094–1096. - PubMed

Publication types

MeSH terms

LinkOut - more resources