. 2011 Sep 27;21(18):1571-7.
doi: 10.1016/j.cub.2011.08.019. Epub 2011 Sep 14.

The snail repressor inhibits release, not elongation, of paused Pol II in the Drosophila embryo

Affiliations

The snail repressor inhibits release, not elongation, of paused Pol II in the Drosophila embryo

Jacques P Bothma et al. Curr Biol. .

Abstract

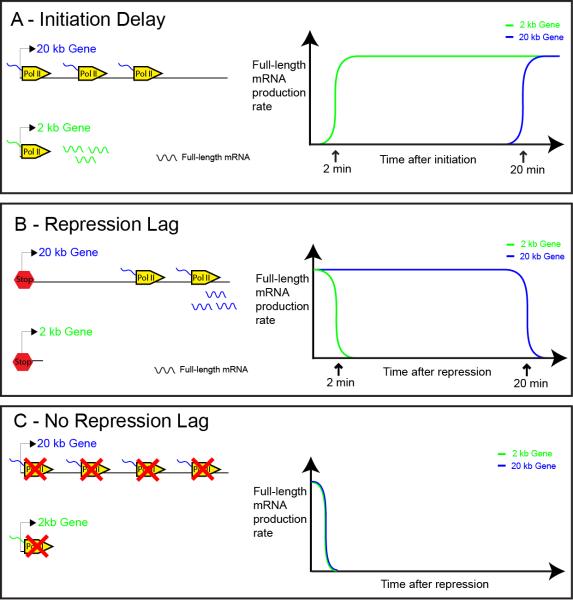
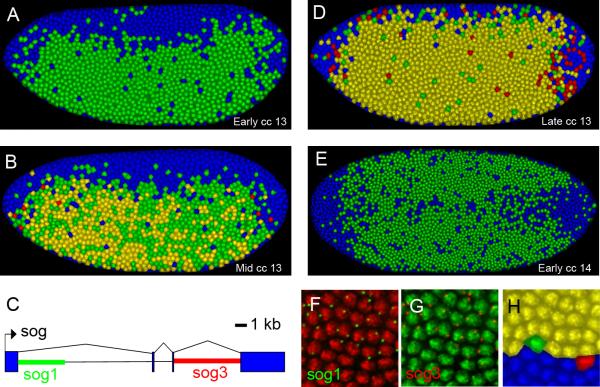
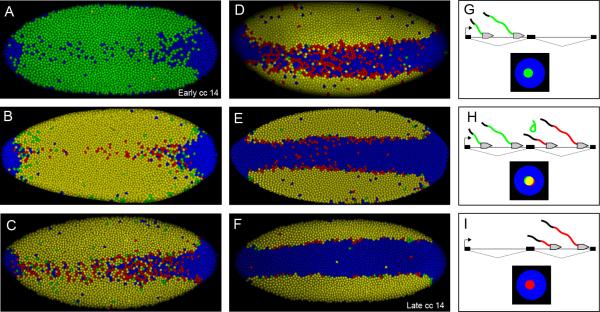
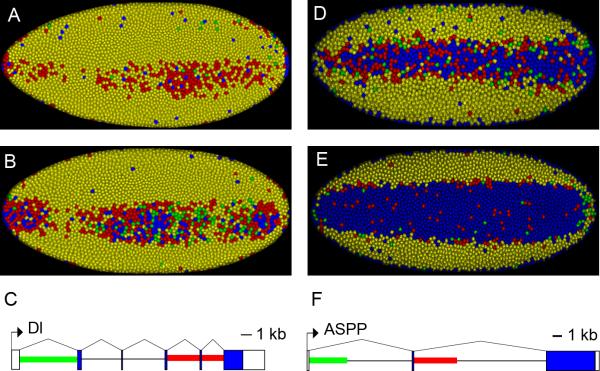
The development of the precellular Drosophila embryo is characterized by exceptionally rapid transitions in gene activity, with broadly distributed maternal regulatory gradients giving way to precise on/off patterns of gene expression within a one-hour window, between two and three hours after fertilization [1]. Transcriptional repression plays a pivotal role in this process, delineating sharp expression patterns (e.g., pair-rule stripes) within broad domains of gene activation. As many as 20 different sequence-specific repressors have been implicated in this process, yet the mechanisms by which they silence gene expression have remained elusive [2]. Here we report the development of a method for the quantitative visualization of transcriptional repression. We focus on the Snail repressor, which establishes the boundary between the presumptive mesoderm and neurogenic ectoderm [3]. We find that elongating Pol II complexes complete transcription after the onset of Snail repression. As a result, moderately sized genes (e.g., the 22 kb sog locus) are fully silenced only after tens of minutes of repression. We propose that this "repression lag" imposes a severe constraint on the regulatory dynamics of embryonic patterning and further suggest that posttranscriptional regulators, like microRNAs, are required to inhibit unwanted transcripts produced during protracted periods of gene silencing.


Figures

Figure 1
Figure 1. Schematic showing how the initiation of transcription and different schemes of repression affect the dynamics of full-length mRNA production
A. Gene models showing the differences in the distribution of polymerase on a 20 kb and 2 kb gene and the amount of full-length mRNA produced some time after initiation. Not enough time has elapsed for Pol II complexes to reach the end of the 20 kb gene but the 2 kb gene is short enough such that multiple complexes have already reached it, allowing the production of full-length mRNA. This process is depicted in the graph showing the rate of full-length mRNA production as a function of time after initiation. It shows that there is a significantly longer delay before Pol II complexes can reach the end of the 20 kb gene (20 mins) and produce productive transcripts, compared to the 2 kb gene (2 mins). B. Gene models showing the differences in the distribution of polymerase on the two genes and the amount of full-length mRNA some time after transcriptional repression, assuming no new Pol II complexes are recruited to the gene after repression but that those on the gene finish elongating. Enough time has elapsed for Pol II complexes to transcribe the length of the 2 kb gene, and hence production of full-length transcripts have ceased. However, not enough time has elapsed for Pol II complexes to reach the end of the 20 kb gene, and so it is still producing full-length mRNA long after the initiation of repression. This process is depicted in the graph showing the rate of full-length mRNA production as a function of time after repression. It shows that there is a significantly longer delay before full-length mRNA production is repressed in the case of the 20 kb gene (20 min), compared to the 2 kb gene (2 min). C. Similar to B except that elongating Pol II complexes on the template are arrested or have their processivity attenuated when the genes are repressed. This would result in a rapid cessation in the production of full-length mRNA for both the 2 kb and 20 kb genes (assumed elongation speed of Pol II is 1 kb/min throughout).
Figure 2
Figure 2. Time course of sog transcription from early cell cycle 13 to early cell cycle 14
All embryos are oriented so that anterior is to the left. A. Lateral view of an embryo that is in the early stages of cc 13. Most of the nuclei contain intense dots of in situ hybridization signal that correspond to nascent transcripts. Only the 5’ intronic probe is detected (see C). The nuclei are false colored according to which combination of probes they contain (see F-H). B. Lateral view of an embryo that is midway through cc 13. Most of the nuclei show in situ signal for the 5’ probe and a subset of these also show staining for the 3’ probe. C. Simplified gene model for the sog transcript showing the location of the three biggest introns and the location of the sequences that the 5’ (green), sog1, and 3’ (red), sog3, intronic in situ probes hybridize to. D. Lateral view of an embryo that is in the late stages of cc 13. Most of the cells express both the 5’ and 3’ probes. E. Ventral view of an embryo that is in the early stages of cc 14. Only isolated 5’ probe is detected. F. Zoomed in section of a cc 14 embryo showing the expression of nascent transcript labeled by the 5’ probe in green. The nuclear stain has been false colored red to maximize the contrast. G. The same section as shown in F but with the 3’ probe labeled in red and the nuclear stain false colored green. H. The same section shown in F&G but after it has been processed with the segmentation algorithm. Isolated and paired nascent transcripts have been identified and nuclei false colored to reflect which combinations of probes are present in each nucleus. Nuclei that contain only isolated green, 5’, probes have been labeled in green. Nuclei that contain only isolated red, 3’, probes have been labeled in red. Nuclei that contain a coincident red and green dot have been labeled in yellow and nuclei that contain no probe have been labeled in blue.
Figure 3
Figure 3. Time course of sog transcription from early cell cycle 14 to late cell cycle 14 with schematic explaining results
All embryos are oriented so that anterior is to the left showing a ventral view. A. Embryo that is in the early stages of cc 14 the embryo is older than embryo shown in Fig. 1E. Most nuclei are only expressing the 5’ (green) probe, but a small number also express 3’ (red) probe. B. Within about 10 min of the first detection of sog nascent transcripts at the onset of cc14, most of the nuclei exhibiting sog expression stain yellow, indicating expression of both 5’ (green) and 3’ (red) intronic sequences. C. During the next several minutes, progressively more nuclei exhibit only 3’ (red) hybridization signals in ventral regions. D. This transition from yellow to red continues and culminates in a “red flash” where the majority of the ventral nuclei that contain nascent transcripts express only the 3’ (red) probe. E. As cc14 continues there is a progressive loss of staining in the presumptive mesoderm. F. Eventually sog nascent transcripts are lost almost entirely in the presumptive mesoderm in late cc14. G. Gene model depicting a gene like sog with multiple introns, where a 5’ (green) probe recognizes the mRNA coded for by the first intron and a 3’ (red) probe recognizes the mRNA coded for by the second intron. Initially only the 5’ (green) probe will hybridize to the nascent transcript. This is because not enough time has elapsed to transcribe the mRNA that the 3’ (red) probe hybridizes to. In an in situ nuclei where this has occurred will have a green dot at the site of nascent transcription. H. After enough time has elapsed for some Pol II complexes to reach the second intron labeled by the 5’ (red) probe, both probes will hybridize and will manifest as a yellow dot in a nucleus. Some of the individual transcripts associated with Pol II complexes that have made it well into the second intron will only hybridize the 3’ (red) probe because the 5’ (green) probe is co-transcriptionally spliced and degraded. I. If repression inhibits new polymerases from initiating transcription, but allow elongating polymerases to finish transcription, then after a time only the 3’ (red) probe will hybridize to nascent transcripts, because all the intronic sequences containing the 5’ (green) probe will have been spliced out and degraded. In an in situ, nuclei where this has occurred will have an isolated red dot at the site of nascent transcription.
Figure 4
Figure 4. Repression of Delta and ASPP transcription in the presumptive mesoderm
All embryos are oriented so that anterior is to the left showing a ventral view. A. cc 14 embryo showing staining for Delta. Both the 5’ (green) and 3’ (red) probes (See C) hybridize to the nascent transcripts in most of the nuclei. However, in the ventral regions a number of nuclei only show the presence of the 3’ (red) probe consistent with repression. (See Fig 3) B. Older embryo showing more nuclei expressing the 3’ (red) probe, consistent with the continuation of Snail mediated repression. C. Simplified gene model for the Dl transcript showing the location of the biggest introns and the location of the mRNA sequences that the 5’ (green) and 3’ (red) intronic in situ probes hybridize to. D. cc 14 embryo showing staining for ASPP. Both the 5’ (green) and 3’ (red) probes (See F) hybridize to the nascent transcripts in most of the nuclei. However, in the ventral regions there is a significant amount of clearing showing a large number of nuclei that only show the presence of the 3’ (red) probe consistent with repression. (See Fig 3) E. Older embryo showing most of the nuclei in the mesoderm without any staining but some isolated nuclei expressing the 3’ (red) probe. This is consistent with the continuation of Snail mediated repression. C. Simplified gene model for the ASPP transcript showing the location of the biggest introns and the location of the mRNA sequences that the 5’ (green) and 3’ (red) intronic in situ probes hybridize to.

Comment in

Similar articles

Cited by

References

    1. Lawrence PA, Struhl G. Morphogens, Compartments and Pattern: Lessons from Drosophila? Cell. 1992;85:951–961. - PubMed
    1. Payankaulam S, Li LM, Arnosti DN. Transcriptional Repression: Conserved and Evolved Features. Curr. Biol. 2010;20:R764–R771. - PMC - PubMed
    1. Kosman D, Ip YT, Levine M, Arora K. Establishment of the mesoderm-neuroectoderm boundary in the Drosophila embryo. Science. 1991;254:118–22. - PubMed
    1. Kasai Y, Nambu JR, Lieberman PM, Crews ST. Dorsalventral patterning in Drosophila: DNA binding of snail protein to the single-minded gene. Proc. Natl. Acad. Sci. 1992;89:3414–3418. - PMC - PubMed
    1. Boulay JL, Dennefeld C, Alberga A. The Drosophila developmental gene snail encodes a protein with nucleic acid binding fingers. Nature. 1987;330:395–398. - PubMed

Publication types

MeSH terms

LinkOut - more resources