. 2011 Nov 25;286(47):40413-22.
doi: 10.1074/jbc.M111.244053. Epub 2011 Sep 15.

Disruption of serine/threonine protein phosphatase 5 (PP5:PPP5c) in mice reveals a novel role for PP5 in the regulation of ultraviolet light-induced phosphorylation of serine/threonine protein kinase Chk1 (CHEK1)

Affiliations

Disruption of serine/threonine protein phosphatase 5 (PP5:PPP5c) in mice reveals a novel role for PP5 in the regulation of ultraviolet light-induced phosphorylation of serine/threonine protein kinase Chk1 (CHEK1)

Lauren Amable et al. J Biol Chem. .

Abstract

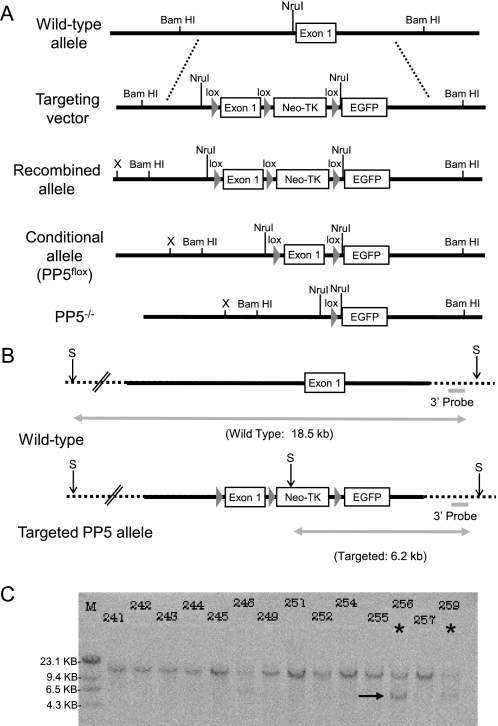
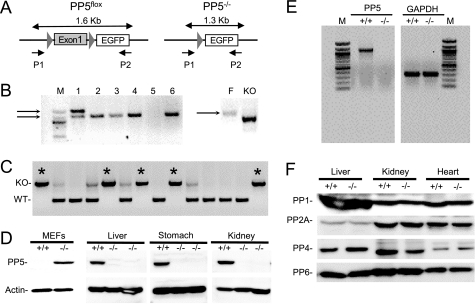
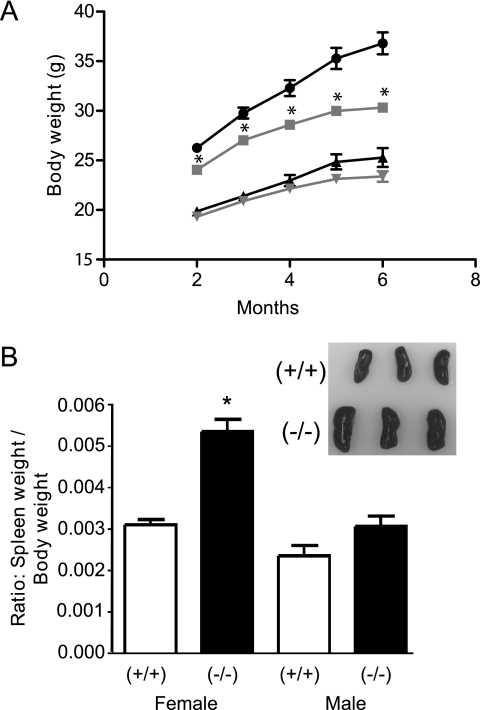
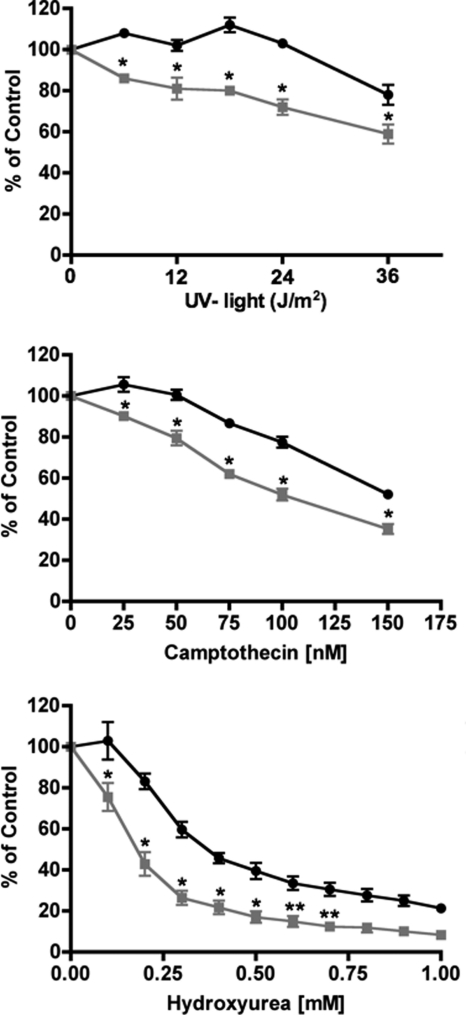
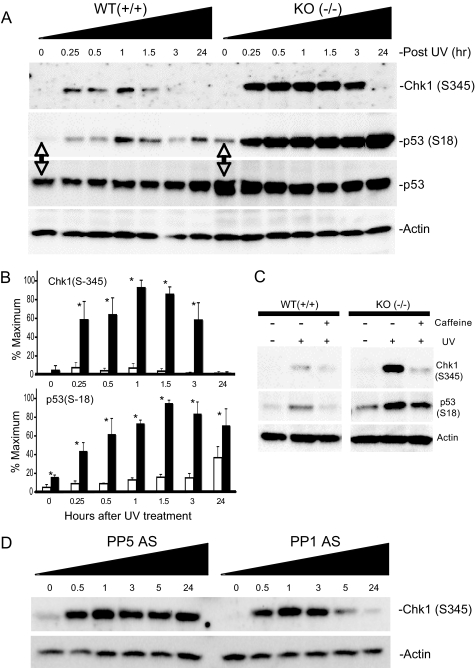
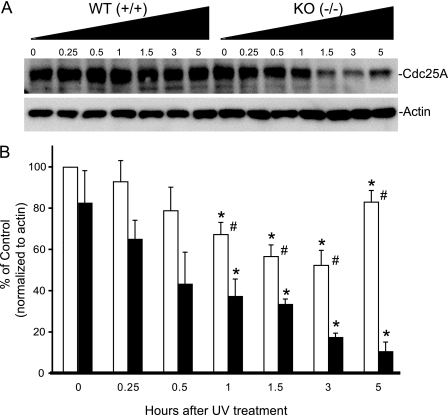
PP5 is a ubiquitously expressed Ser/Thr protein phosphatase. High levels of PP5 have been observed in human cancers, and constitutive PP5 overexpression aids tumor progression in mouse models of tumor development. However, PP5 is highly conserved among species, and the roles of PP5 in normal tissues are not clear. Here, to help evaluate the biological actions of PP5, a Cre/loxP-conditional mouse line was generated. In marked contrast to the early embryonic lethality associated with the genetic disruption of other PPP family phosphatases (e.g. PP2A and PP4), intercrosses with mouse lines that ubiquitously express Cre recombinase starting early in development (e.g. MeuCre40 and ACTB-Cre) produced viable and fertile PP5-deficient mice. Phenotypic differences caused by the total disruption of PP5 were minor, suggesting that small molecule inhibitors of PP5 will not have widespread systemic toxicity. Examination of roles for PP5 in fibroblasts generated from PP5-deficient embryos (PP5(-/-) mouse embryonic fibroblasts) confirmed some known roles and identified new actions for PP5. PP5(-/-) mouse embryonic fibroblasts demonstrated increased sensitivity to UV light, hydroxyurea, and camptothecin, which are known activators of ATR (ataxia-telangiectasia and Rad3-related) kinase. Further study revealed a previously unrecognized role for PP5 downstream of ATR activation in a UV light-induced response. The genetic disruption of PP5 is associated with enhanced and prolonged phosphorylation of a single serine (Ser-345) on Chk1, increased phosphorylation of the p53 tumor suppressor protein (p53) at serine 18, and increased p53 protein levels. A comparable role for PP5 in the regulation of Chk1 phosphorylation was also observed in human cells.


Figures

FIGURE 1.
FIGURE 1.
Southern analysis of ES cells indicating homologous recombination. A, schematic representation of the wild-type PP5 mouse allele, targeting vector, recombined allele, conditional allele (PP5flox), and the final PP5 knock-out (PP5−/−) allele generated by Cre recombinase. loxP sites are indicated by triangles (lox). The relative positions of sequences recognized by restriction endonucleases used in analysis are indicated above the lines. B, diagram showing the position of sites recognized by SpeI (S) and the expected size of DNA produced by SpeI digestion of genomic DNA from ES cells containing wild-type or the targeted PP5 alleles. C, autoradiogram showing the hybridization of a 32P-labeled 3′ external probe to genomic DNA from ES cells following digestion with SpeI. For Southern analysis, probes that target a region of the PP5 gene outside the targeting vector (indicted by dashed line) were used to ensure the identification of clones in which homologous recombination had occurred. An asterisk designates an example of a positive clone (i.e. clone 256), and an arrow indicates the 6.2-kb band produced by SpeI digestion of genomic DNA in which homologous recombination has occurred.
FIGURE 2.
FIGURE 2.
Generation of PP5flox and PP5−/− mice. A, schematic representation of PP5flox (left panel) and PP5−/− alleles (right panel). PCR using primers targeting a region 5′of exon 1 (P1) and enhanced GFP (P2) produce a 1.6-kb product with DNA from mice containing Exon 1. A 1.3-kb product is produced when exon 1 is removed. DNA recognized by P2 is not present in wild-type mice. B, left panel, PCR analysis of litter 160 illustrating the detection of heterozygous (PP5flox/−; lane 1) and PP5−/− (lanes 2–4 and 6) animals. Right panel, PCR products produced from DNA of homozygous PP5flox (F) and PP5−/− (KO) mice. C, representative PCR products used for genotyping, showing PP5+/+ (WT; single lower band), heterozygous (two bands), and PP5−/− mice (KO; single upper band; *) produced using a sense primer complementary to the PP5 promoter and an antisense primer complementary to a region in intron one (see “Experimental Procedures”). D, Western analysis of MEFs and the indicated whole tissue homogenates produced from wild-type (+/+) and PP5 knock-out (−/−) mice. E, ethidium bromide staining of agarose gels to detect PCR products separated by electrophoresis. Under identical conditions, RNA from wild-type (+/+) and PP5 knock-out (−/−) mice was used to produce cDNA, which was then used as template for PCR-mediated amplification using primers that amplify PP5 (5′-GCTTTGCGGCATGGCGATGGC-3′ and 5′-CAGCACTTTGCCATTGATAC-3′). GAPDH was amplified as a control (5′-GCCCATCACCATCTTCCAG-3′ and 5′-TGAGCCCTTCCACAATGCC-3′). F, Western blots showing the levels of PP1, PP2A, PP4, and PP6 in whole organ homogenates obtained from wild-type (+/+) and PP5 knock-out (−/−) mice.
FIGURE 3.
FIGURE 3.
Phenotypic differences between PP5−/− and PP5+/+ mice. A, comparison of body weights between PP5−/− (gray lines) and PP5+/+ (black lines) mice with time. Circles and squares represent male mice; triangles and inverted triangles represent females. B, comparison of spleen weight in male and female mice at ∼1 year of age plotted as a ratio of spleen weight to total body weight. The data shown are the means ± S.E., n = 10–22. The asterisk indicates a statistically significant difference between PP5−/− and PP5+/+ animals (p < 0.05) by two-way ANOVA (A) and one-way ANOVA (B).
FIGURE 4.
FIGURE 4.
Sensitivity of MEFs to UV light, camptothecin, or hydroxyurea. MEFs produced from PP5+/+ (circles) or PP5−/− (squares) animals were treated as indicated. After 24 h, cell viability was measured as described under “Experimental Procedures.” The data represent the means ± S.E. from three separate experiments in which four replicate plates for each condition and cell type were processed simultaneously. * (p < 0.01) and ** (p < 0.05) denote statistically significant differences (two-way ANOVA).
FIGURE 5.
FIGURE 5.
Enhanced phosphorylation of Chk1 and p53 in PP5−/− MEFs or HeLa cells following exposure to UV light. MEFs (embryonic day 13.5) derived from PP5+/+ (WT) or PP5−/− (KO) littermate embryos or HeLa cells, as indicated below, were exposed to 24 J/m2 UV light. At the times indicated, the cells were harvested and phospho-Chk1 (Ser-345), phospho-p53 (Ser-18), p53, and actin protein levels were detected by Western analysis. A, representative images of three separate experiments conducted with MEFs. B, quantitation of image data from separate experiments comparing the phosphorylation of Chk1 (Ser-345) in the top panel and p53 (Ser-18) in the bottom panel. Means ± S.E., n = 3; the asterisk denotes a statistically significant difference (p < 0.05). C, representative image illustrating the effect of caffeine on UV light-induced phosphorylation of Chk1 (Ser-345) and p53 (Ser-18). PP5+/+ (WT) or PP5−/− (KO) MEFs were treated with 1 mm caffeine and then exposed to UV light (24 J/m2). After 30 min, the cells were harvested and processed for Western analysis. Phosphospecific antibodies that recognize the phosphorylated forms of Chk1 (Ser-345) or p53 (Ser-18) were used to detect changes in phosphorylation. Actin levels were measured as a control for loading. D, enhanced phosphorylation of Chk1 in following exposure to UV light. HeLa cells treated with antisense oligonucleotides targeting PP5 (ISIS 15534) or PP1 (ISIS 14436), as indicated. After 48 h, the cells were exposed to 24 J/m2 UV light. At the times indicated, the cells were harvested, and phospho-Chk1 (Ser-345) and actin protein levels were detected by Western analysis. The images shown are representative images of three or more separate experiments.
FIGURE 6.
FIGURE 6.
Changes in Cdc25A levels in MEFs following treatment with UV light. MEFs produced from wild-type PP5+/+ or PP5 disrupted PP5−/− mice were treated with UV light as in Fig. 5. At the time indicated, the cells were harvested and processed for Western analysis using an antibody that recognizes Cdc25A. A, representative images illustrating changes in Cdc25A protein levels. B, quantitation of images from three separate experiments (mean ± S.E., n = 3); the asterisk indicates a statistically significant difference between UV treatment and untreated controls (p < 0.05); # indicates a statistically significant difference between PP5+/+ and PP5−/− MEFs receiving identical treatment (p < 0.05) by two-way ANOVA.

References

    1. Reinhardt H. C., Yaffe M. B. (2009) Curr. Opin. Cell Biol. 21, 245–255 - PMC - PubMed
    1. Zhou B. B., Elledge S. J. (2000) Nature 408, 433–439 - PubMed
    1. Xu Y., Baltimore D. (1996) Genes Dev. 10, 2401–2410 - PubMed
    1. Brown E. J., Baltimore D. (2000) Genes Dev. 14, 397–402 - PMC - PubMed
    1. Smits V. A., Warmerdam D. O., Martin Y., Freire R. (2010) Front. Biosci. 15, 840–853 - PubMed

Publication types

MeSH terms