. 2011 Nov 17;118(20):5540-9.
doi: 10.1182/blood-2011-04-351742. Epub 2011 Sep 14.

Comprehensive analysis of tumor microenvironment cytokines in Waldenstrom macroglobulinemia identifies CCL5 as a novel modulator of IL-6 activity

Affiliations

Comprehensive analysis of tumor microenvironment cytokines in Waldenstrom macroglobulinemia identifies CCL5 as a novel modulator of IL-6 activity

Sherine F Elsawa et al. Blood. .

Abstract

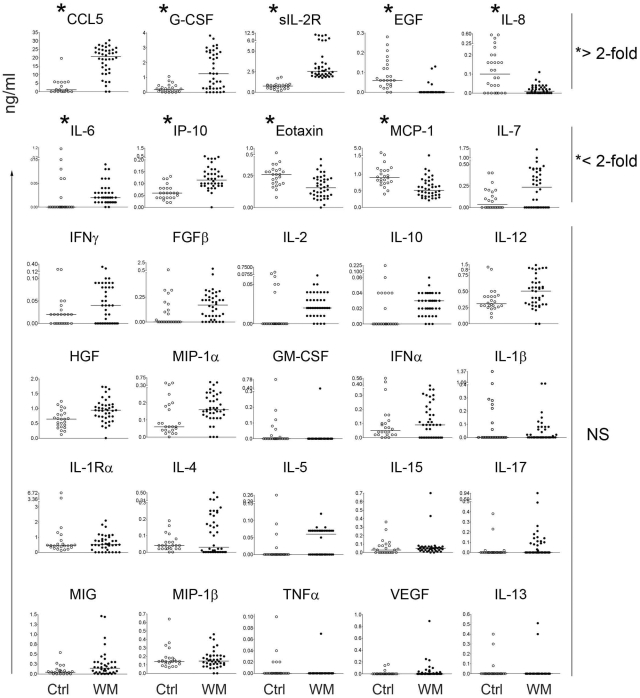
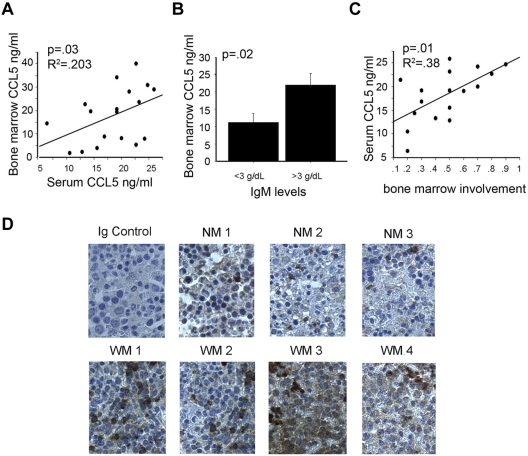
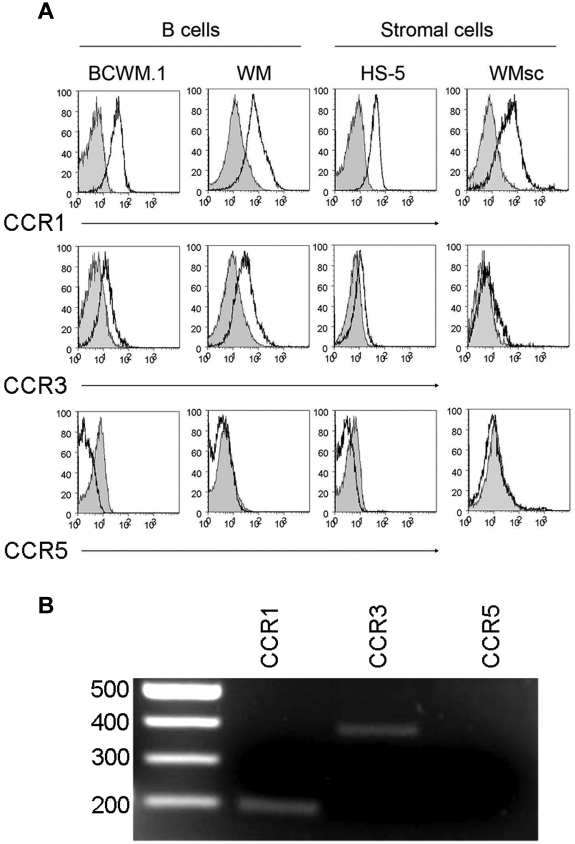
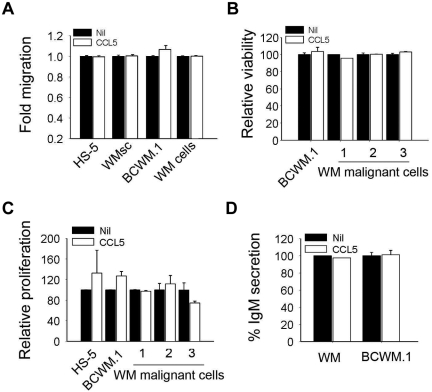
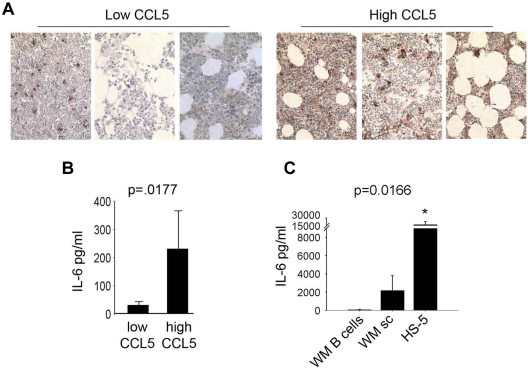
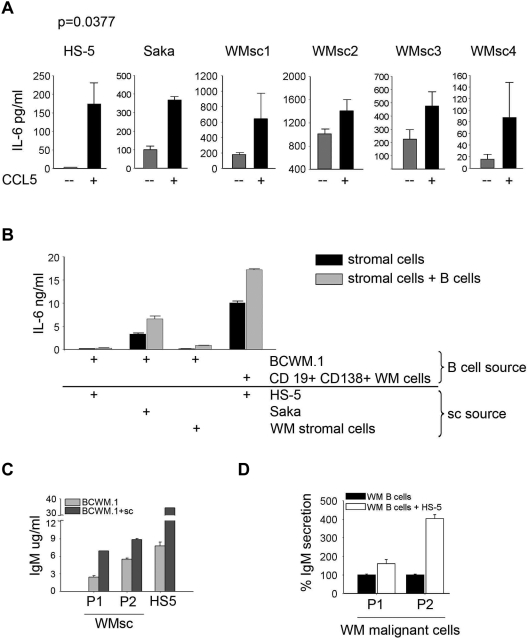
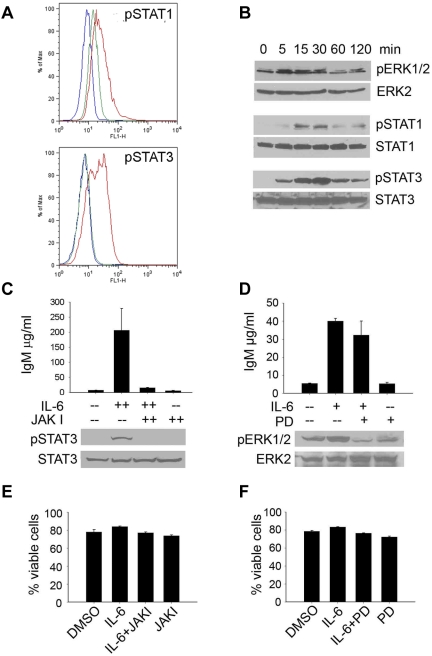
Although proinflammatory and chemotactic cytokines can profoundly affect the tumor microenvironment, and many of them have been shown to have therapeutic efficacy in preclinical models, the role of these molecules in Waldenström macroglobulinemia (WM) remains poorly understood. In this study, simultaneous analysis of WM patient sera and bone marrow biopsies identified a set of dysregulated cytokines including CCL5, G-CSF, and soluble IL-2 receptor, that were significantly elevated in WM patients whereas IL-8 and EGF levels were significantly lower in these patients compared with healthy controls. Interestingly, CCL5 levels positively correlated with features of disease aggressiveness such as elevated IgM levels and bone marrow involvement. Functional analysis of tumor microenvironment revealed a functional correlation between CCL5 levels and IL-6 levels, a proinflammatory cytokine with an important role in normal and malignant B-cell biology. Furthermore, CCL5 stimulated IL-6 secretion in WM stromal cells resulting in increased IgM secretion by WM malignant cells via the JAK/STAT signaling pathway. Thus, together these results define a novel signaling network in the WM tumor microenvironment controlling IgM secretion and suggest CCL5 as a potential target for the treatment of this disease.


Figures

Figure 1
Figure 1
Multiplex analysis of serum cytokines in WM patient sera identifies dysregulated cytokines. Multiplex ELISA analysis screening was done on 40 WM samples (closed circles) and 24 healthy controls (open circles). Data displayed represent individual patients and the bars represent the median value (*statistically significant cytokines; P < .001).
Figure 2
Figure 2
Elevated CCL5 expression correlates with disease activity. (A) Correlations between serum CCL5 and CCL5 in the bone marrow of patients with matched samples (n = 20). (B) Correlation between CCL5 levels in bone marrow plasma and IgM levels. (C) Correlation between CCL5 levels in serum and degree of bone marrow involvement by lymphoplasmacytic cells. (D) Immunohistochemical staining of CCL5 (brown) in bone marrow specimens of 3 healthy donors (NM1-NM3) and 4 WM patients (WM1-WM4) was performed using anti-CCL5 mAb as described in “Methods.” Images shown are original magnification ×400.
Figure 3
Figure 3
CCL5 receptors expressed on WM tumor cells. (A) CCL5 receptor expression (CCR1, CCR3, and CCR5) was determined by FACS analysis on BCWM.1 cells, CD19+CD138+ cells from WM patients, HS-5 cells; and primary stromal cells from WM patient by staining cells with anti-CCR1, anti-CCR3, or anti-CCR5 antibodies (white histograms); and the appropriate isotype controls (gray histograms) followed by flow cytometry analysis as described in “Methods.” This experiment was repeated 3 times with similar results. Representative histograms are shown. (B) Differential expression of mRNA in WM stromal cells. Total RNA was isolated from sorted cells and reverse transcribed. cDNA was amplified by primers for CCR1, CCR3, and CCR5. Shown is a gel from one representative donor. The expected sizes for the amplified products of CCR1, CCR3, and CCR5 are 201, 396, and 459 bp, respectively.
Figure 4
Figure 4
CCL5 has no effect on cell migration, survival, and proliferation. (A) Migration ability of BCWM.1, HS-5, WMsc, and CD19+CD138+ from WM patient cells (WM cells) in response to CCL5 (500 ng/mL). Data represent fold-increased migration compared with either media alone or CCL5 as described. (B) Effect of CCL5 (500 ng/mL) on the viability of BCWM.1, HS-5, and CD19+CD138+ cells from WM patients (n = 3). Data represent cell viability in the presence of CCL5 compared with the media alone. (C) Effect of CCL5 on the proliferation of serum starved BCWM.1, HS-5, and CD19+CD138+ cells from WM patients (n = 3). Cell proliferation was assessed using thymidine incorporation and is presented as relative proliferation compared with cells cultured in the presence of media alone. (D) IgM secretion by BCWM.1 or CD19+CD138+ cells from WM patient cultured in the presence or absence of CCL5 (500 ng/mL). Values represent mean of duplicate values ± SEM.
Figure 5
Figure 5
CCL5 levels correlated with IL-6 levels in WM. (A) Immunohistochemical staining for IL-6 in bone marrow biopsy specimens of 6 WM patient samples (3 with high CCL5 expression and 3 with low CCL5 expression) was performed using anti–IL-6 antibody as described in experimental procedures. Images shown are original magnification ×400. (B) Quantitative correlation of bone marrow IL-6 and CCL5 levels in bone marrow plasma samples from WM patients (n = 60). IL-6 and CCL5 levels were quantitated by ELISA as described in “Methods.” CCL5 levels were divided to high or low based on median value. (C) Average IL-6 production by HS-5 stromal cells (0.1 × 10⁶ cells/well), CD19+CD138+ cells from WM patients (0.5 × 10⁶ cells/well, n = 2 patients) and stromal cells generated from WM patients (0.1 × 10⁶ cells/well, n = 4 patients) was determined using a human IL-6 ELISA.
Figure 6
Figure 6
CCL5 induces IL-6 secretion. (A) HS-5 (0.01 × 10⁶ cells/well), Saka and stromal cells generated from WM patients (WMsc1-WMsc4; 0.1 × 10⁶ cells/well) were serum starved overnight and then cultured in the presence or absence of 500 ng/mL Rantes/CCL5 for 24 hours and IL-6 levels were determined in the culture supernatant by ELISA. (B) IL-6 secretion in coculture wells of stromal cells (0.1 × 10⁶ cells/well) and BCWM.1 or CD19+CD138+ cells from WM patients (0.5 × 10⁶ cells/well). Cells were serum starved overnight and then cocultured for 2 days, then supernatants were harvested and used to quantitate IL-6 levels by ELISA. (C) IgM secretion in coculture wells of HS-5 stromal cells or WMsc (P1 and P2; 0.1 × 10⁶ cells/well) and BCWM.1 (0.5 × 10⁶ cells/well) or (D) HS-5 cells cocultured with CD19+CD138+ cells from WM patients (P1 and P2). Cells were serum starved overnight and then cocultured for 2 days then supernatants were harvested and used to quantitate IgM levels by ELISA.
Figure 7
Figure 7
IL-6 signaling induces IgM secretion. (A) BCWM.1 cells were serum-starved and treated with 50 ng/mL IL-6 for 15 minutes. After fixation and permeabilization, cells were probed for the phosphorylated forms of STATs 1-6. The blue histogram represents the isotype control; green represents baseline STAT phosphorylation in untreated BCWM.1 cells; red represents STAT phosphorylation on IL-6 stimulation. This experiment was performed 3 times, and representative histograms are shown. (B) HS-5 cells were plated in 6-well plates overnight and then serum starved overnight. Cells were then treated with 50 ng/mL IL-6 for the indicated times. Cells were then lysed and lysates used to determine activation of MAPK and JAK/STAT signaling pathways by immunoblotting. This experiment was repeated 3 times with similar results (C) IgM secretion by serum starved BCWM.1 cells cultured in the presence or absence of JAKI inhibitor (300nM) or DMSO control for 30 minutes and, then stimulated with IL-6 (50 ng/mL) for 3 days. To determine inhibition of STAT3 by JAKI inhibitor a Western blot was run with whole-cell lysates from serum starved BCWM.1 cultured in the presence of JAKI inhibitor (300nM) for 30 minutes and then treated with IL-6 (50 ng/mL) for 30 minutes. Immunoblots were repeated 2 times with similar results. (D) IgM secretion by serum starved BCWM.1 cells pretreated with or without the ERK inhibitor PD98059 (PD) or DMSO for 30 minutes and then treated with IL-6 (50 ng/mL) as indicated. Cell supernatants were harvested after 3 days and used to determine IgM secretion by ELISA. Experiments were performed twice in triplicate. Inhibition of Erk1/2 phosphorylation was confirmed by immunoblotting by culturing serum starved BCWM.1 in the presence or absence of PD inhibitor (50μM) for 30 minutes and then treated with IL-6 (50 ng/mL) for 30 minutes. Immunoblots were run twice with similar results. (E-F) Viability in the presence of either a pan-JAK (E) or MEK (F) inhibitor was assessed using annexin/propidium iodine staining. Experiments were performed 3 times. Data are presented as the average viability ± SEM.

References

    1. Grivennikov SI, Karin M. Inflammatory cytokines in cancer: tumour necrosis factor and interleukin 6 take the stage. Ann Rheum Dis. 2011;70(suppl 1):i104–108. - PubMed
    1. Goldstein H, Kim A. Immunoglobulin secretion and phosphorylation of common proteins are induced by IL-2, IL-4, and IL-6 in the factor responsive human B cell line, SKW6.4. J Immunol. 1993;151(12):6701–6711. - PubMed
    1. Baldridge MT, King KY, Goodell MA. Inflammatory signals regulate hematopoietic stem cells. Trends Immunol. 2011;32(2):57–65. - PMC - PubMed
    1. Weidle UH, Klostermann S, Eggle D, Kruger A. Interleukin 6/interleukin 6 receptor interaction and its role as a therapeutic target for treatment of cachexia and cancer. Cancer Genomics Proteomics. 2010;7(6):287–302. - PubMed
    1. Dinarello CA. Blocking interleukin-1beta in acute and chronic autoinflammatory diseases. J Intern Med. 2011;269(1):16–28. - PMC - PubMed

Publication types

MeSH terms