. 2011 Oct;22(10):1846-55.
doi: 10.1681/ASN.2011010026. Epub 2011 Sep 15.

AMPK mediates the initiation of kidney disease induced by a high-fat diet

Affiliations

AMPK mediates the initiation of kidney disease induced by a high-fat diet

Anne-Emilie Declèves et al. J Am Soc Nephrol. 2011 Oct.

Abstract

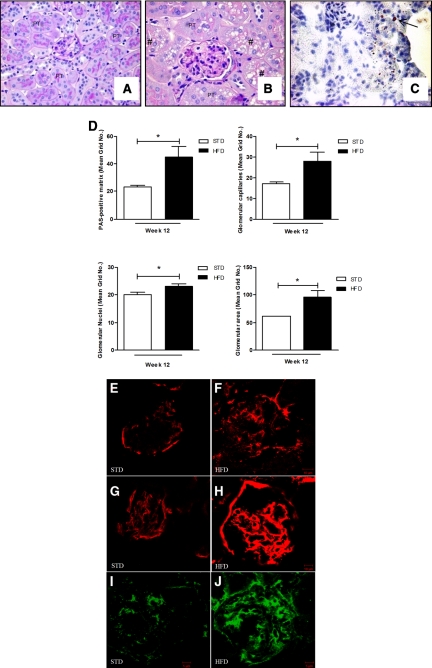
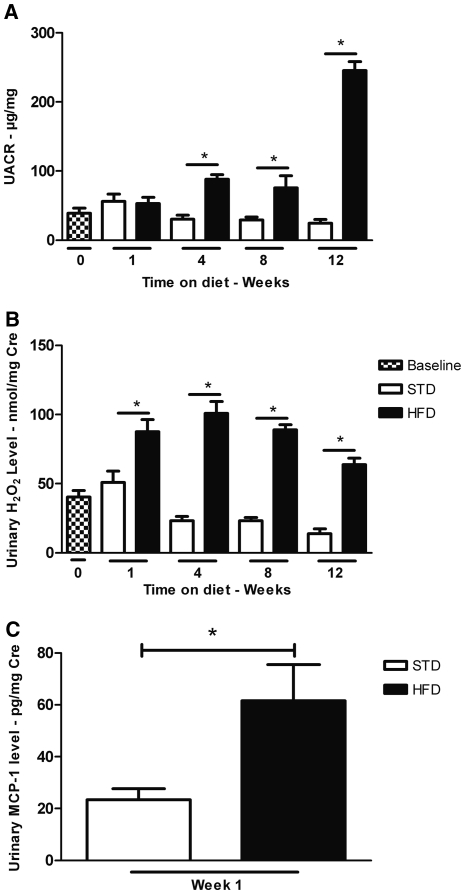
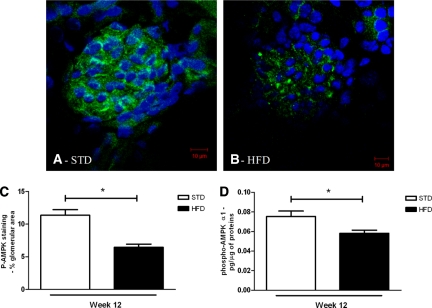
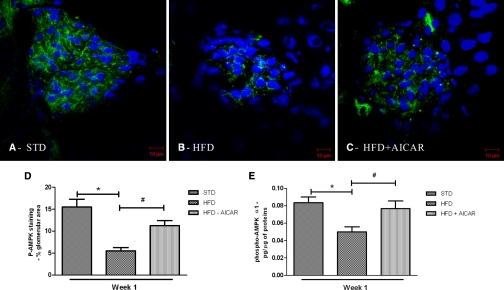
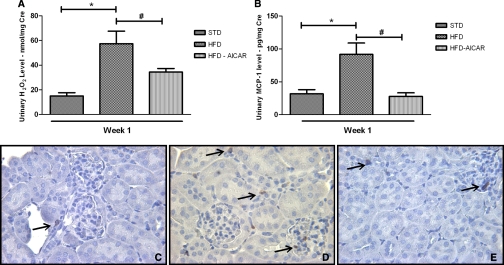
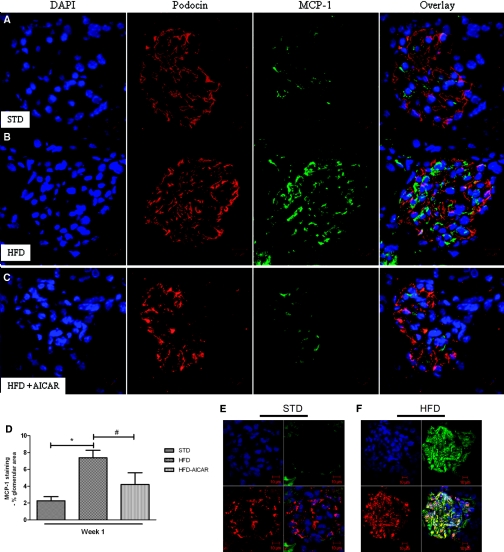
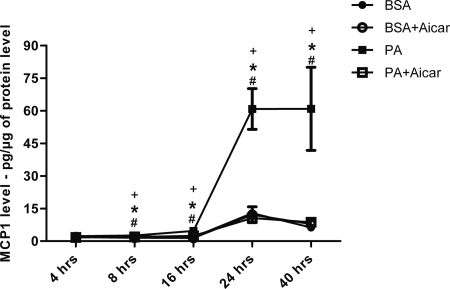
The mechanisms underlying the association between obesity and progressive renal disease are not well understood. Exposure to a high-fat diet decreases levels of the cellular energy sensor AMPK in many organs, including the kidney, but whether AMPK contributes to the pathophysiology of kidney disease induced by a high-fat diet is unknown. In this study, we randomly assigned C57BL/6J mice to a standard or high-fat diet. After 1 week, mice fed a high-fat diet exhibited an increase in body weight, renal hypertrophy, an increase in urine H(2)O(2) and urine MCP-1, and a decrease in circulating adiponectin levels and renal AMPK activity. Urine ACR progressively increased after 4 weeks of a high-fat diet. After 12 weeks, kidneys of mice fed a high-fat diet demonstrated a marked increase in markers of fibrosis and inflammation, and AMPK activity remained significantly suppressed. To determine whether inhibition of AMPK activity explained these renal effects, we administered an AMPK activator along with a high-fat diet for 1 week. Although AMPK activation did not abrogate the weight gain, it reduced the renal hypertrophy, urine H(2)O(2), and urine and renal MCP-1. In vitro, AMPK activation completely inhibited the induction of MCP-1 by palmitic acid in mesangial cells. In conclusion, these data suggest that the energy sensor AMPK mediates the early renal effects of a high-fat diet.


Figures

Figure 1.
Figure 1.
HFD increases glomerular area and matrix accumulation. (A, B) Mice fed a HFD displayed large glomeruli and vacuolated cytoplasm (#). (C) Oil-red O staining on kidney sections on a HFD at 12 weeks: arrow shows the accumulated neutral lipid. (D) Quantitative analysis of glomeruli demonstrates increased mesangial matrix expansion, capillary filtration area, nuclei, and overall surface area. Immunofluorescence microscopy of cortical sections demonstrates increased collagen type I (E, F), collagen type IV (G, H), and fibronectin (I, J) in mice fed a HFD (F, H, and J) versus a STD (E, G, and I) for 12 weeks. Values are means ± SEM. n = 5 in each group. Statistical analyses were performed by unpaired t test *P ≤ 0.05 versus mice on STD. PT, proximal tubule.
Figure 2.
Figure 2.
HFD increases urine albumin, H2O2 and MCP-1. (A) Urine albumin/creatinine ratio (UACR) increases with HFD at 4, 8, and 12 weeks. (B) Urine H2O2/creatinine level in mice on a HFD increases by 1 week and remains elevated during the 12-week period. (C) Urine MCP-1/creatinine level is increased in mice fed a HFD for 1 week. Values are means ± SEM. n = 5 in each group. Statistical analyses were performed by one-way ANOVA followed by Newman–Keuls test (A, B) *P ≤ 0.05 versus mice on a STD at corresponding time point.
Figure 3.
Figure 3.
Renal p-AMPK is reduced with HFD at 12 weeks. Representative photomicrographs of p-AMPK staining (green color) in glomeruli from mice on a (A) STD or (B) HFD. The nuclei were stained using DAPI (blue color). Semiquantitative analysis of p-AMPK-positive staining per glomerular area (C) and quantitative analysis of p-AMPK level in the protein extractions from renal cortex (D) at week 12 of experimental protocol. Values are means ± SEM. n = 5 in each group. Statistical analyses were performed by unpaired t test. *P ≤ 0.05 versus mice on STD.
Figure 4.
Figure 4.
Renal p-AMPK is reduced with HFD at 1 week and increased with AICAR. Representative photomicrographs of p-AMPK (green) staining in glomeruli from mice on a (A) STD, (B) HFD, or (C) HFD + AICAR for 1 week. Nuclei were stained using DAPI (blue color). Semiquantitative analysis of p-AMPK-positive staining per glomerular area (D), and quantitative analysis of p-AMPK level in the protein extractions from renal cortex (E) at week 1. Values are means ± SEM. n = 6 in each group. Statistical analyses were performed by one-way ANOVA followed by Newman–Keuls test. *P ≤ 0.05 versus mice on STD; #P ≤ 0.05 versus mice on HFD.
Figure 5.
Figure 5.
Urine markers of inflammation with HFD are reduced by AMPK activation. (A) Urine H2O2/creatinine level (A) and (B) urine MCP-1/creatinine level in mice fed a STD, HFD, or HFD + AICAR for 1 week. Values are means ± SEM. n = 6 in each group. Statistical analyses were performed by one-way ANOVA followed by Newman–Keuls test *P ≤ 0.05 versus mice on STD; #P ≤ 0.05 versus mice on HFD. Representative photomicrographs of macrophage staining in cortex from mice on a (C) STD, (D) HFD, or (E) HFD + AICAR.
Figure 6.
Figure 6.
Increased glomerular MCP-1 with HFD is reduced with AMPK activation. Representative photomicrographs of glomeruli from mice on a (A) STD, (B) HFD, or (C) HFD + AICAR, and (D) semiquantitative analysis of MCP-1-positive staining per glomerular area at week 1. Colocalization of glomerular MCP-1 in mesangial cells. Representative photomicrographs of glomeruli from mice on a (E) STD or (F) HFD at week 12. Megsin (red)/MCP-1 (green); nuclei (blue). Values are means ± SEM. n = 6 in each group. Statistical analyses were performed by one-way ANOVA followed by Newman–Keuls test. *P ≤ 0.05 versus mice on STD; #P ≤ 0.05 versus mice on HFD.
Figure 7.
Figure 7.
Stimulation of MCP-1 with palmitic acid (PA) in mesangial cells is blocked by AMPK activation. Quantitative analysis of MCP-1 level measured in the conditioned media of murine mesangial cells (MMC) at 4, 8, 16, 24, and 40 hours after stimulation by PA. Values are means ± SEM. n = 4 in each group. Statistical analyses were performed by one-way ANOVA followed by Newman–Keuls test. *P ≤ 0.05 versus BSA; #P ≤ 0.05 versus BSA + AICAR; +P ≤ 0.05 versus PA + AICAR.

References

    1. Ogden CL, Carroll MD, Curtin LR, McDowell MA, Tabak CJ, Flegal KM: Prevalence of overweight and obesity in the United States, 1999–2004. JAMA 295: 1549–1555, 2006 - PubMed
    1. Bruce KD, Byrne CD: The metabolic syndrome: Common origins of a multifactorial disorder. Postgrad Med J 85: 614–621, 2009 - PubMed
    1. Praga M, Morales E: Obesity, proteinuria and progression of renal failure. Curr Opin Nephrol Hypertens 15: 481–486, 2006 - PubMed
    1. Wang Y, Chen X, Song Y, Caballero B, Cheskin LJ: Association between obesity and kidney disease: A systematic review and metaanalysis. Kidney Int 73: 19–33, 2008 - PubMed
    1. Kincaid-Smith P: Hypothesis: Obesity and the insulin resistance syndrome play a major role in end-stage renal failure attributed to hypertension and labelled ‘hypertensive nephrosclerosis’. J Hypertens 22: 1051–1055, 2004 - PubMed

Publication types

MeSH terms