

Timing molecular motion and production with a synthetic transcriptional clock
- PMID: 21921236
- PMCID: PMC3189071
- DOI: 10.1073/pnas.1100060108
Timing molecular motion and production with a synthetic transcriptional clock
Abstract
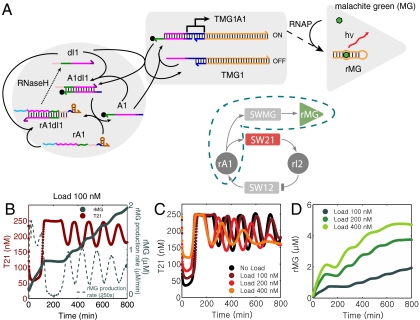
The realization of artificial biochemical reaction networks with unique functionality is one of the main challenges for the development of synthetic biology. Due to the reduced number of components, biochemical circuits constructed in vitro promise to be more amenable to systematic design and quantitative assessment than circuits embedded within living organisms. To make good on that promise, effective methods for composing subsystems into larger systems are needed. Here we used an artificial biochemical oscillator based on in vitro transcription and RNA degradation reactions to drive a variety of "load" processes such as the operation of a DNA-based nanomechanical device ("DNA tweezers") or the production of a functional RNA molecule (an aptamer for malachite green). We implemented several mechanisms for coupling the load processes to the oscillator circuit and compared them based on how much the load affected the frequency and amplitude of the core oscillator, and how much of the load was effectively driven. Based on heuristic insights and computational modeling, an "insulator circuit" was developed, which strongly reduced the detrimental influence of the load on the oscillator circuit. Understanding how to design effective insulation between biochemical subsystems will be critical for the synthesis of larger and more complex systems.
Conflict of interest statement
The authors declare no conflict of interest.
Figures
 , and the RNA degradation rate is
  . The binding rates of the insulator RNA output and the load are chosen as
  and
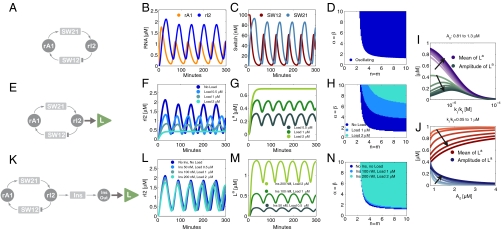
and  . (A): Diagram for the simple model for the oscillator. (B): Time traces for the oscillator species rA1 and rI2. (C): Time traces for the oscillator species SW12 and SW21. (D): Oscillatory domain of the simple model as a function of the nondimensional parameters α = β and m = n. (E): Oscillator scheme with consumptive load coupled to rI2. (F, G): Time traces for the oscillator and load for consumptive coupling on rI2. (H): The oscillatory domain shrinks as a function of [Ltot] for the consumptive coupling to rI2. (I): Mean and amplitude of the active load [La] as a function of the ratio of kr and kf, when the driving input is [rI2] = A0 + A1 sin ωt, with A0 varying between 0.81 (light color) and 1.3 μM, and A1 = .8 μM, ω = 0.001 rad/s. (J): Mean and amplitude of the active load signal [La] as a function of the baseline A0 for the input oscillating signal, for ratios kr/kf varying between 0.05 and 1 μM. For (I) and (J), [Ltot] = 1μM (K): Oscillator scheme with consumptive insulating circuit and consumptive load. (L, M): Time traces for the oscillator and load when the insulating genelet is used to amplify rI2. (N): The perturbation of the oscillatory domain is reduced by using a small amount of an additional genelet (insulator) that amplifies the oscillatory signal.
References
-
- Winfree AT. The Geometry of Biological Time. New York, NY: Springer-Verlag; 1980.
-
- Atkinson MR, Savageau M, Myers J, Ninfa A. Development of genetic circuitry exhibiting toggle switch or oscillatory behavior in Escherichia coli. Cell. 2003;113:597–607. - PubMed
-
- Elowitz MB, Leibler S. A synthetic oscillatory network of transcriptional regulators. Nature. 2000;403:335–338. - PubMed
-
- Fung E, et al. A synthetic gene-metabolic oscillator. Nature. 2005;435:118–122. - PubMed
Publication types
MeSH terms
Substances
LinkOut - more resources
Full Text Sources
