. 2012 Jan;37(1):56-62.
doi: 10.1097/SHK.0b013e3182356f3e.

Presence of preexisting antibodies mediates survival in sepsis

Affiliations

Presence of preexisting antibodies mediates survival in sepsis

Rituparna Moitra et al. Shock. 2012 Jan.

Abstract

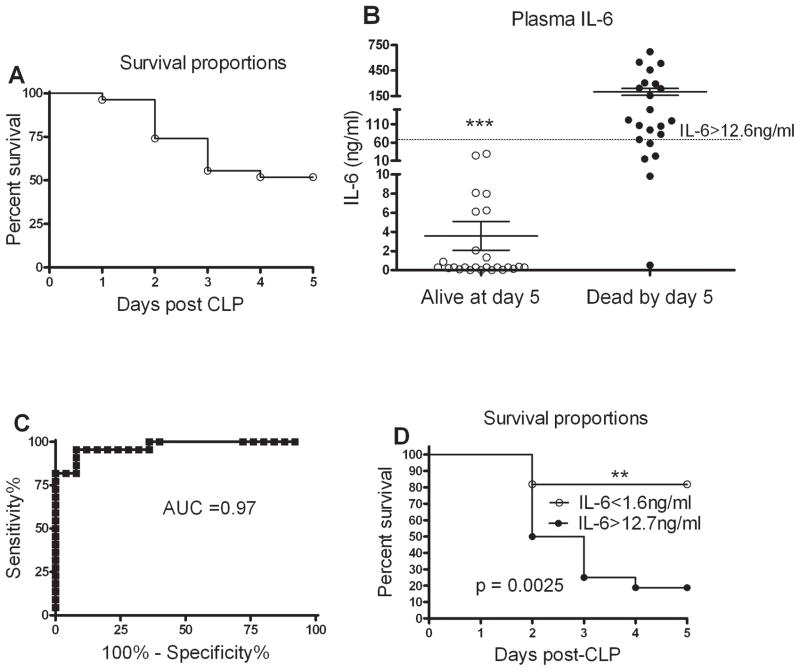
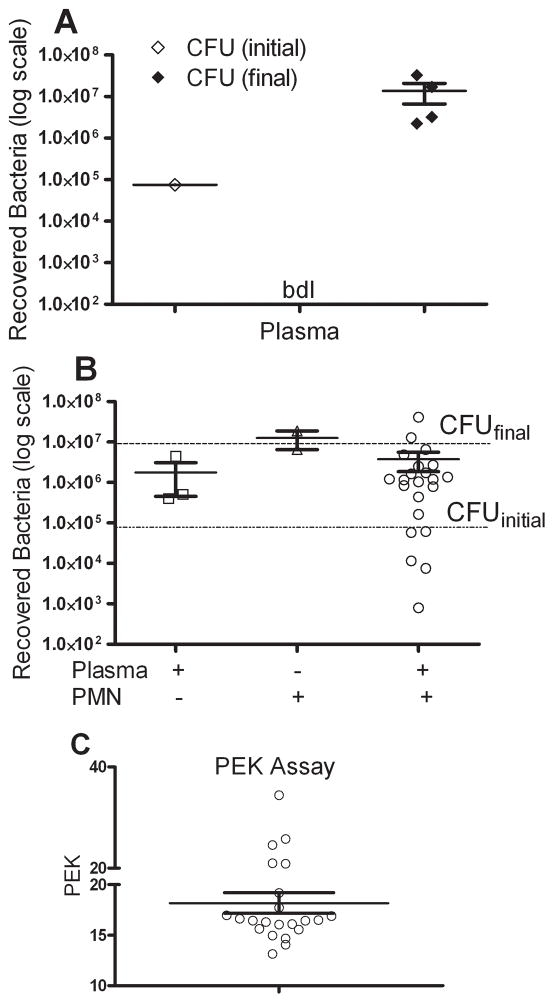
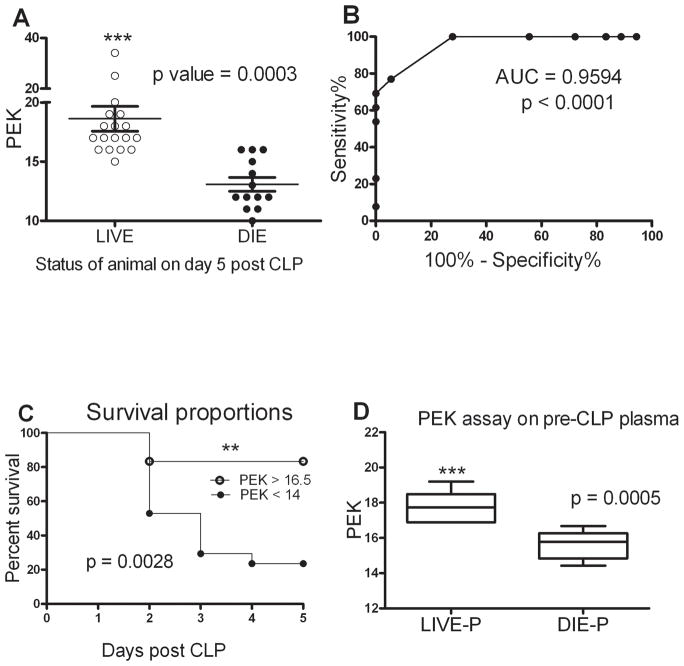
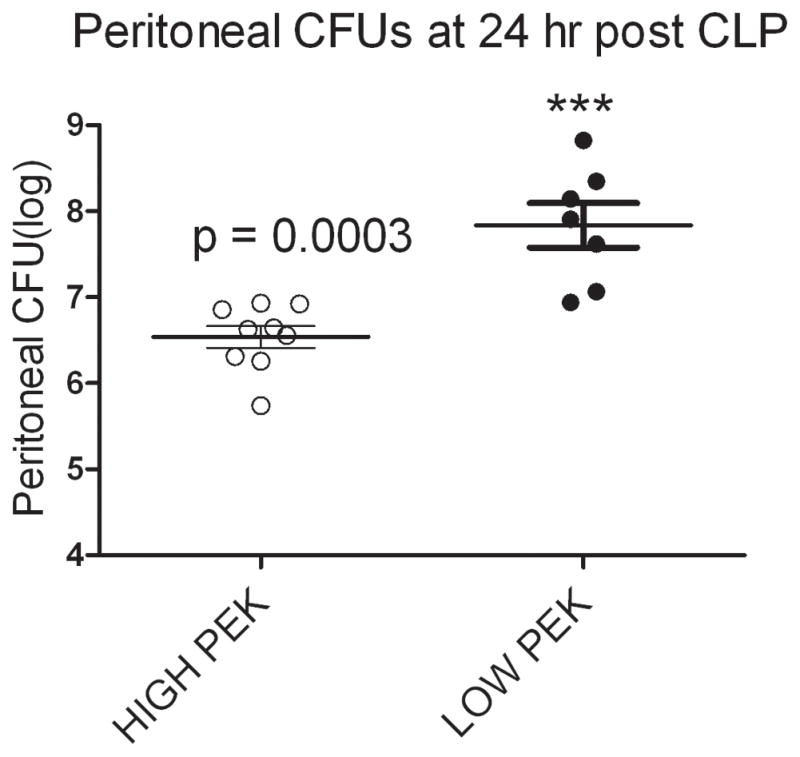
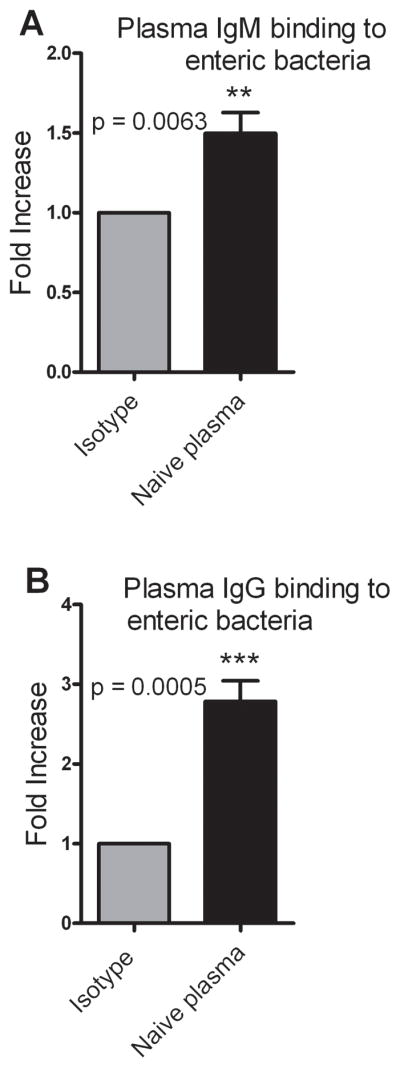
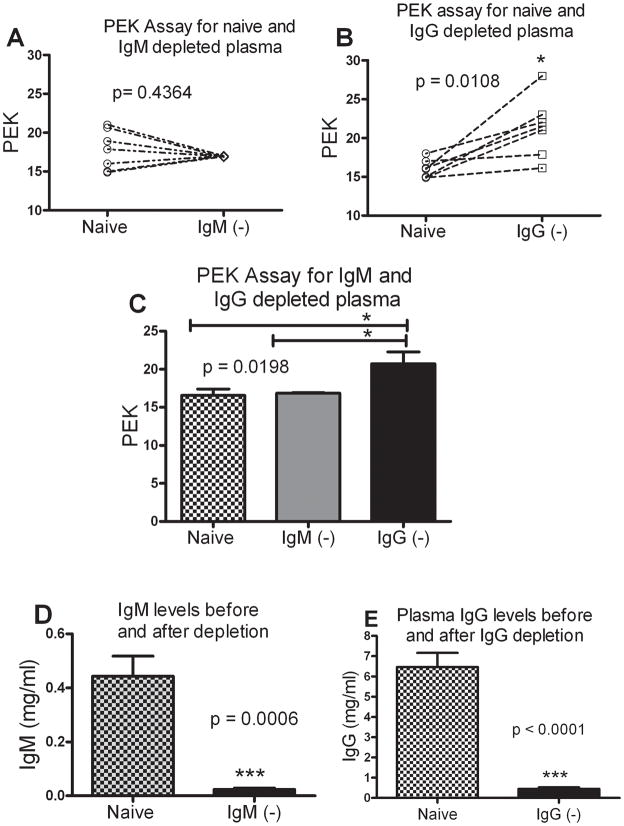
Sepsis is one of the leading causes of death in hospitals worldwide. Even with optimal therapy, severe sepsis results in 50% mortality, indicating variability in the response of individuals towards treatment. We hypothesize that the presence of preexisting antibodies present in the blood before the onset of sepsis induced by cecal ligation and puncture (CLP) in mice accounts for the differences in their survival. A plasma-enhanced killing (PEK) assay was performed to calculate the PEK capacity of plasma, that is, the ability of plasma to augment polymorphonuclear neutrophil killing of bacteria. Plasma-enhanced killing was calculated as PEK = [1 / log (N)] × 100, where N = number of surviving bacteria; a higher PEK indicated better bacterial killing. A range of PEK in plasma collected from mice before CLP was observed, documenting individual differences in bacterial killing capacity. Mortality was predicted based on plasma IL-6 levels at 24 h after CLP. Mice predicted to die (Die-P) had a lower PEK (<14) and higher peritoneal bacterial counts at 24 h after sepsis compared with those predicted to live (Live-P) with a PEK of greater than 16. Mice with PEK of less than 14 were 3.1 times more likely to die compared with the group with PEK of greater than 16. To understand the mechanism of defense conferred by the preexisting antibodies, binding of IgM or IgG to enteric bacteria was documented by flow cytometry. To determine the relative contribution of IgM or IgG, the immunoglobulins were specifically immunodepleted from the naive plasma samples and the PEK of the depleted plasma measured. Compared with naive plasma, depletion of IgM had no effect on the PEK. However, depletion of IgG increased PEK, suggesting that an inhibitory IgG binds to antigenic sites on bacteria preventing optimal opsonization of the bacteria. These data demonstrate that, before CLP, circulating inhibitory IgG antibodies exist that prevent bacterial killing by polymorphonuclear neutrophils in a CLP model of sepsis.


Conflict of interest statement

Disclosures

The authors have no financial conflicts of interest.

Figures

Figure 1
Figure 1. Plasma IL-6 predicts mortality
(A) The CLP protocol results in 65% mortality during the first 5 days. None of the mice died during the first 24 hours, such that plasma samples were available for each mouse. n= 22. (B) Plasma IL-6 levels 24 hour post CLP were significantly higher in those mice that died. n = 22–25 for each group, data were combined from 3 independent experiments. Results are shown as mean ± SEM. (C) Receiver Operator Characteristic (ROC) curve to test for specificity and sensitivity of 24 hour plasma IL-6 to predict outcome. The area under the curve (AUC) has 100 % specificity (12.6 ng/ml) and 100% sensitivity (1.7 ng/ml) with AUC close to 1 making it an excellent biomarker. (D) Survival curve for mice during the acute phase of sepsis based on their plasma IL-6 cut offs. p = 0.0025 from Log-rank (Mantel-Cox) Test. n= 11 for IL-6 <1.6 ng/ml and n=17 IL-6>12.7 ng/ml.
Figure 2
Figure 2. Plasma Enhanced Killing (PEK) assay using naïve plasma
(A) Assay controls. The initial inoculum of bacteria was the number of bacteria combined with the plasma (CFU initial). The actual CFUs were verified by culture. Plasma only shows that no bacteria were present when plasma alone was cultured. The number of bacteria at the end of the 2 hour assay (CFU final) showed a significant increase from the initial inoculum, as expected. bdl = below detection level. (B) Plasma alone mixed with bacteria showed a slight decrease in the number of CFUs compared to the CFU final. Neutrophils plus bacteria shows that neutrophils alone had limited ability to kill bacteria. However, plasma + bacteria + PMNs showed a wide range in the capacity of the plasma from an individual mouse to enhanced bacterial killing. (C) Data from panel B was re-graphed using the equation described in methods. Each symbol is the result from an individual mouse. A higher PEK number indicates greater capacity to kill bacteria. Data cumulative of 3 independent experiments. n= 22 for naïve plasma.
Figure 3
Figure 3. Comparison of plasma enhanced killing sepsis mortality
(A) Mice alive after 5 days of CLP-induced sepsis had a much higher PEK capacity in plasma samples obtained prior to the onset of sepsis. n= 18 for Live and 13 for Die group. p<0.05 when compared to Live. Results are shown as mean ± SEM and each symbol is the value for an individual mouse. Data are representative of 3 independent experiments. (B) Receiver Operator Characteristic (ROC) curve to test for specificity and sensitivity of PEK capacity of pre-procedure plasma. Area under the curve (AUC) represents 100 % specificity (PEK<14) and 100% sensitivity (PEK >16). (C) Survival curve for mice during the acute phase of sepsis based on their pre-CLP plasma PEK capacity discrimination values. p = 0.0025 from Log-rank (Mantel-Cox) test. n= 18 for PEK > 16 and n=13 PEK <14. (D) Mice predicted to die based on plasma IL-6 levels had lower PEK values compared to mice predicted to live. n= 9 and 7 for Live-P and Die-P respectively. Results are shown as box and whiskers with 10–90 percentile range ± SEM. p<0.05 when compared to Live-P.
Figure 4
Figure 4. Peritoneal bacteria in mice after sepsis
Mice were stratified into High PEK or Low PEK based on the PEK assay of the naïve plasma. CLP were performed on these mice and the peritoneal lavage at 24 hour post CLP was harvested. Mice with low PEK (PEK <14) value had greater bacterial counts compared to those with high PEK (PEK >16). n= 9 and 7 for High PEK and Low PEK respectively and are the same mice used in figure 3D. p<0.05 when compared to High PEK.
Figure 5
Figure 5. Plasma IgM and IgG binds to enteric bacteria
Plasma was used to opsonize enteric bacteria and the opsonized bacteria were stained with either PE anti–mouse IgM or FITC anti–mouse IgG. Isotype controls for IgM and IgG were PE Rat IgG2a, κ and FITC Rat IgG1, κ respectively. (A) Plasma IgM binding to enteric bacteria represented as a fold increase over isotype control. n = 8. (B) Plasma IgG binding of enteric bacteria represented as a fold increase over isotype control. n = 7. Data are the combined results of 3 independent experiments. p < 0.05 when compared to isotype control.
Figure 6
Figure 6. Critical role of plasma IgG in determining PEK capacity
(A) PEK of IgM depleted plasma when compared to the naïve pre-CLP plasma. Each symbol is an individual mouse comparing naïve and IgM depleted (IgM−) PEK values. (B) Change in PEK of IgG depleted plasma when compared to the naïve pre-CLP plasma. Each symbol is an individual mouse comparing naïve and IgG depleted (IgG−) PEK values. In every sample, depletion of IgG increases the PEK numbers. (C) Depletion of IgM does not change the PEK value, while depletion of IgG results in a significant increase. n=7 both groups. p < 0.05 when compared to naive and IgG depleted plasma. (D) Plasma IgM levels before and after depletion. (E) Plasma IgG levels before and after depletion.

References

    1. Angus DC, Pereira CA, Silva E. Epidemiology of Severe Sepsis around the World. Endocr Metab Immune Disord Drug Targets. 2006;6(2):207–12. - PubMed
    1. Angus DC, Linde-Zwirble WT, Lidicker J, Clermont G, Carcillo J, Pinsky MR. Epidemiology of Severe Sepsis in the United States: Analysis of Incidence, Outcome, and Associated Costs of Care. Crit Care Med. 2001;29(7):1303–10. - PubMed
    1. Angus DC, Wax RS. Epidemiology of Sepsis: An Update. Crit Care Med. 2001;29(7 Suppl):S109–16. - PubMed
    1. Quartin AA, Schein RM, Kett DH, Peduzzi PN. Magnitude and Duration of the Effect of Sepsis on Survival. Department of Veterans Affairs Systemic Sepsis Cooperative Studies Group. Jama. 1997;277(13):1058–63. - PubMed
    1. Martin GS, Mannino DM, Eaton S, Moss M. The Epidemiology of Sepsis in the United States from 1979 through 2000. N Engl J Med. 2003;348(16):1546–54. - PubMed

Publication types