. 2011 Oct;22(7):663-73.
doi: 10.1097/FBP.0b013e32834aff54.

Some determinants of morphine effects on intracranial self-stimulation in rats: dose, pretreatment time, repeated treatment, and rate dependence

Affiliations

Some determinants of morphine effects on intracranial self-stimulation in rats: dose, pretreatment time, repeated treatment, and rate dependence

Ahmad A Altarifi et al. Behav Pharmacol. 2011 Oct.

Abstract

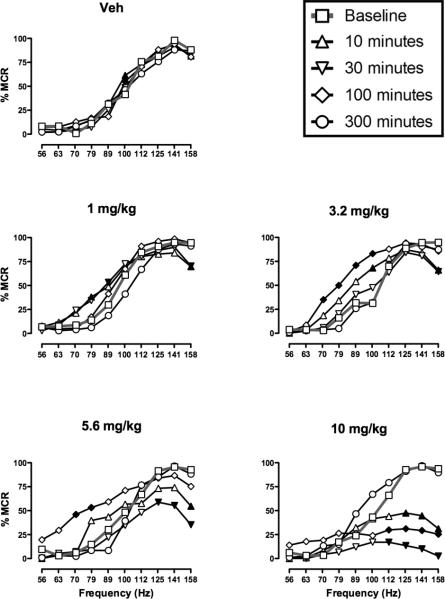
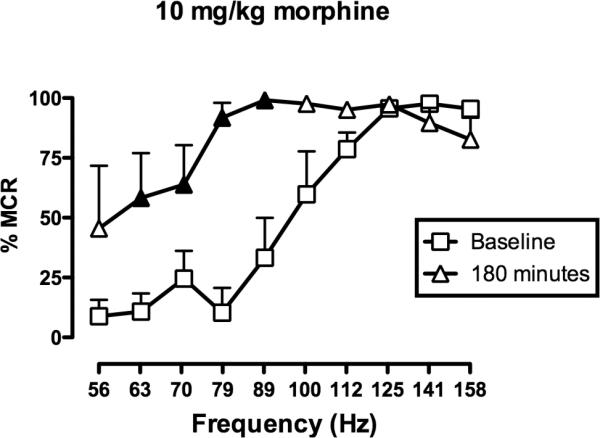
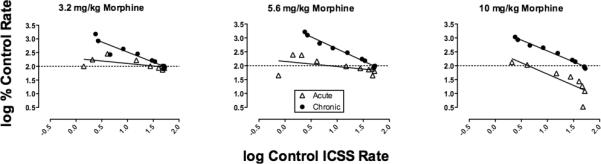
Intracranial self-stimulation (ICSS) is a procedure used to evaluate the abuse liability of drugs. The μ opioid receptor agonist morphine is an acknowledged drug of abuse, and this study examined factors that may influence expression of abuse-related morphine effects on ICSS in rats. Adult male rats were equipped with intracranial electrodes targeting the medial forebrain bundle, and 10 stimulus frequencies (56-158 Hz in 0.05 log increments) were available during each daily session under a continuous reinforcement schedule. The primary dependent variable was the ICSS rate at each frequency. Under baseline conditions, the ICSS rate increased with frequency. After acute morphine (1-10 mg/kg), rate-decreasing effects predominated at early pretreatment times (10-30 min) and rate-increasing effects predominated at later pretreatment times (100-180 min). Acute morphine effects dissipated after 300 min. Repeated morphine (3.2-18 mg/kg/day×7 days at each dose) produced tolerance to rate-decreasing effects, enhanced expression of rate-increasing effects, and enhanced rate dependency of morphine effects. Withdrawal from repeated morphine produced small but significant dose-dependent decreases in ICSS. These results show that the magnitude and valence of morphine effects on rates of ICSS in rats are strongly influenced by morphine dose and pretreatment time, history of morphine exposure, and baseline ICSS rate.


Figures

Fig 1
Fig 1
Morphine pretreatment produced dose-, time- and frequency-dependent changes in ICSS. Horizonal axes: Frequency of electrical brain stimulation in hertz (log scale). Vertical axes: ICSS rate expressed as percent maximum control rate (%MCR). Each panel shows ICSS frequency-rate curves determined before (Baseline) or at various times after (10-300 min) treatment with vehicle or morphine (1.0-10 mg/kg). Filled symbols indicate frequencies at which ICSS rates were significantly lower or higher than baseline as determined by the Holm-Sidak post hoc test following a significant analysis of variance (p<0.05). ANOVA results were as follows: Vehicle: significant main effect of frequency [F(9,45)=44.0; p<0.001], significant main effect of time [F(4,20)=3.5; p=0.025], no significant frequency×time interaction [F(36,180)=1.4; NS]; 1 mg/kg morphine: significant main effect of frequency [F(9,45)=148.0; p<0.001], no significant main effect of time [F(4,20)=1.6; NS], significant frequency×time interaction [F(36,180)=3.0; p<0.001]; 3.2 mg/kg morphine: significant main effect of frequency [F(9,45)=98.7; p<0.001], significant main effect of time [F(4,20)=3.9; p<0.02], significant frequency×time interaction [F(36,180)=2.5; p<0.001]; 5.6 mg/kg morphine: significant main effect of frequency [F(9,45)=88.1; p<0.001], significant main effect of time [F(4,20)=4.2; p<0.02], significant frequency×time interaction [F(36,180)=4.0; p<0.001]; 10 mg/kg : significant main effect of frequency [F(9,45)=45.4; p<0.001], significant main effect of time [F(4,20)=4.0; p<0.02], significant frequency×time interaction [F(36,180)=9.0; p<0.001]. All points show mean data for 6 rats, and error bars are omitted for clarity.
Fig 2
Fig 2
10 mg/kg morphine facilitated ICSS after 180 minutes. Horizonal axis: Frequency of electrical brain stimulation in hertz (log scale). Vertical axis: ICSS rate expressed as percent maximum control rate (%MCR). Filled symbols indicate frequencies at which ICSS rates were significantly higher than baseline as determined by the Holm-Sidak post hoc test following a significant analysis of variance (p<0.05). ANOVA revealed a significant main effect of frequency [F(9,18)=17.3; p<0.001], no significant effect of treatment [F(1,2)=9.9; p=0.09], but a significant frequency×treatment interaction [F(9,18)=4.0; p<0.01]. All points show mean data for 3 rats, and error bars are omitted for clarity.
Fig 3
Fig 3
Effects of chronic morphine on ICSS. Horizonal axes: Frequency of electrical brain stimulation in hertz (log scale). Vertical axes: ICSS rate expressed as percent maximum control rate (%MCR). Rats were treated for 28 consecutive days with an ascending sequences of four morphine doses (3.2, 5.6, 10 and 18 mg/kg/day). Each dose was administered for 7 days, and ICSS frequency-rate curves were determined 30 minutes after each injection. Each panel shows frequency-rate data obtained prior to chronic morphine (baseline) and on the 1st and 7th days of treatment with each morphine dose. Filled symbols indicate frequencies at which ICSS rates were significantly lower or higher than baseline, and asterisks indicate frequencies at which ICSS rates on Day 7 were significantly higher than rates on Day 1, as determined by the Holm-Sidak post hoc test following a significant analysis of variance (p<0.05). ANOVA results were as follows: 3.2 morphine: significant main effect of frequency [F(9,36)=28.2; p<0.001], significant main effect of day [F(2,8)=5.3; p<0.05], significant frequency×day interaction [F(18,72)=4.4; p<0.001]; 5.6 morphine: significant main effect of frequency [F(9,36)=18.5; p<0.001], significant main affect of day [F(2,8)=4.5; p<0.05], significant frequency×day interaction [F(18,72)=4.5; p<0.001]; 10 morphine: significant main effect of frequency [F(9,36)=25.2; p<0.001], no significant main affect of day [F(2,8)=3.0; NS], and a significant frequency×day interaction [F(18,72)=3.2; p<0.001]; 18 morphine: significant main effect of frequency [F(9,36)=27.6; p<0.001], no significant main affect of day [F(2,8)=2.2; NS], and a significant frequency×day interaction [F(18,72)=5.9; p<0.001]. All points show mean data for 5 rats, and error bars are omitted for clarity.
Fig 4
Fig 4
Effects of morphine abstinence on ICSS. The left panel shows the total number of stimulations per component expressed as a percent of baseline stimulations per component 23.5 hours after the last injection of each dose and during three days after the last dose of 18 mg/kg morphine. Horizonal axis: Dose of morphine (mg/kg) prior to abstinence. Vertical axis: Percent baseline number of stimulations per component. One way ANOVA indicated a significant main effect of abstinence condition [F(6,24)=3.13; p<0.025]. Asterisks indicate conditions under which total number of stimulations was significantly lower than baseline (100%), as determined by the Dunnett's post hoc test. The right panel shows the baseline frequency-rate curve and the frequency-rate curve determined on the day after the last dose of 18 mg/kg morphine. Horizontal axis: frequency of brain stimulation in hertz (log scale). Vertical axis: ICSS rate expressed as percent maximum control response rate (%MCR). Two-way ANOVA indicated a significant main effect of frequency [F(9,36)=57.1; p<0.001], significant main effect of day [F(1,4)=8.3; p<0.05], but no significant frequency×day interaction [F(9,36=1.3; NS]. Filled symbols indicate frequencies at which reinforcement rates were significantly lower than baseline as determined by the Holm-Sidak post hoc test. All bars and symbols show mean data from five rats, and error bars in the right panel show SEM.
Figure 5
Figure 5
Rate dependency of morphine effects on ICSS. Horizonal axes: Log control ICSS rate (in units of stimulations/frequency trial) at each of the 10 frequencies of brain stimulation. Vertical axes: Log percent control ICSS rate observed 30 min after morphine treatment. Panels show effects of 3.2, 5.6 and 10 mg/kg morphine during the acute dosing phase of the study, and after the 7th daily dose during the chronic dosing phase of the study. All points show mean data for 5-6 rats.

References

    1. Adams WJ, Lorens SA, Mitchell CL. Morphine enhances lateral hypothalamic self-stimulation in the rat. Proc Soc Exp Biol Med. 1972;140:770–1. - PubMed
    1. Babbini M, Davis WM. Time-dose relationships for locomotor activity effects of morphine after acute or repeated treatment. Br J Pharmacol. 1972;46:213–24. - PMC - PubMed
    1. Bermudez-Rattoni F, Cruz-Morales S, Reid LD. Addictive agents and intracranial stimulation (ICS): novel antagonists and agonists of morphine and pressing for ICS. Pharmacol Biochem Behav. 1983;18:777–84. - PubMed
    1. Carlezon WA, Jr, Chartoff EH. Intracranial self-stimulation (ICSS) in rodents to study the neurobiology of motivation. Nat Protoc. 2007;2:2987–95. - PubMed
    1. Carlezon WA, Jr, Wise RA. Morphine-induced potentiation of brain stimulation reward is enhanced by MK-801. Brain Res. 1993;620:339–42. - PubMed

Publication types

MeSH terms