

Development of an integrated metabolomic profiling approach for infectious diseases research
- PMID: 21922104
- PMCID: PMC3746514
- DOI: 10.1039/c1an15590c
Development of an integrated metabolomic profiling approach for infectious diseases research
Abstract
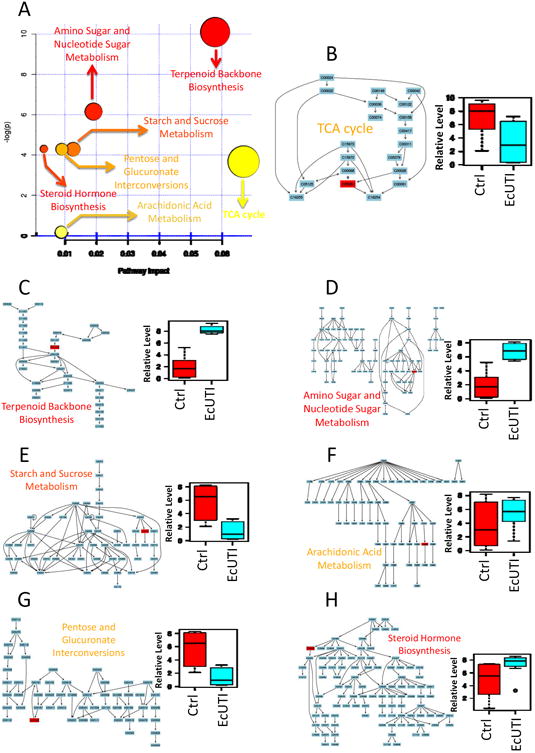
Metabolomic profiling offers direct insights into the chemical environment and metabolic pathway activities at sites of human disease. During infection, this environment may receive important contributions from both host and pathogen. Here we apply an untargeted metabolomics approach to identify compounds associated with an E. coli urinary tract infection population. Correlative and structural data from minimally processed samples were obtained using an optimized LC-MS platform capable of resolving ~2300 molecular features. Principal component analysis readily distinguished patient groups and multiple supervised chemometric analyses resolved robust metabolomic shifts between groups. These analyses revealed nine compounds whose provisional structures suggest candidate infection-associated endocrine, catabolic, and lipid pathways. Several of these metabolite signatures may derive from microbial processing of host metabolites. Overall, this study highlights the ability of metabolomic approaches to directly identify compounds encountered by, and produced from, bacterial pathogens within human hosts.
Conflict of interest statement
The authors have no conflict of interest
Figures


Similar articles
-
Metabolomics strategy for diagnosing urinary tract infections.Nat Commun. 2025 Mar 18;16(1):2658. doi: 10.1038/s41467-025-57765-y. Nat Commun. 2025. PMID: 40102424 Free PMC article.
-
Metabolomic Analysis Using Liquid Chromatography/Mass Spectrometry for Gastric Cancer.Appl Biochem Biotechnol. 2015 Aug;176(8):2170-84. doi: 10.1007/s12010-015-1706-z. Epub 2015 Jun 19. Appl Biochem Biotechnol. 2015. PMID: 26088916
-
1H NMR spectroscopy-based metabolomics analysis for the diagnosis of symptomatic E. coli-associated urinary tract infection (UTI).BMC Microbiol. 2017 Sep 21;17(1):201. doi: 10.1186/s12866-017-1108-1. BMC Microbiol. 2017. PMID: 28934947 Free PMC article.
-
Separation strategies for untargeted metabolomics.J Sep Sci. 2011 Dec;34(24):3460-9. doi: 10.1002/jssc.201100532. Epub 2011 Oct 4. J Sep Sci. 2011. PMID: 21972197 Review.
-
Metabolomic Strategies Involving Mass Spectrometry Combined with Liquid and Gas Chromatography.Adv Exp Med Biol. 2017;965:77-98. doi: 10.1007/978-3-319-47656-8_4. Adv Exp Med Biol. 2017. PMID: 28132177 Review.
Cited by
-
Metabolic Adaptations of Uropathogenic E. coli in the Urinary Tract.Front Cell Infect Microbiol. 2017 Jun 8;7:241. doi: 10.3389/fcimb.2017.00241. eCollection 2017. Front Cell Infect Microbiol. 2017. PMID: 28642845 Free PMC article. Review.
-
Real-time health monitoring through urine metabolomics.NPJ Digit Med. 2019 Nov 11;2:109. doi: 10.1038/s41746-019-0185-y. eCollection 2019. NPJ Digit Med. 2019. PMID: 31728416 Free PMC article.
-
Identification of Novel Biomarkers in Late Preterm Neonates with Respiratory Distress Syndrome (RDS) Using Urinary Metabolomic Analysis.Metabolites. 2023 May 9;13(5):644. doi: 10.3390/metabo13050644. Metabolites. 2023. PMID: 37233686 Free PMC article.
-
A HPLC-Q-TOF-MS-based urinary metabolomic approach to identification of potential biomarkers of metabolic syndrome.J Huazhong Univ Sci Technolog Med Sci. 2014 Apr;34(2):276-283. doi: 10.1007/s11596-014-1271-7. Epub 2014 Apr 8. J Huazhong Univ Sci Technolog Med Sci. 2014. PMID: 24710945
-
Integrative analysis of metabolome and gut microbiota in diet-induced hyperlipidemic rats treated with berberine compounds.J Transl Med. 2016 Aug 5;14(1):237. doi: 10.1186/s12967-016-0987-5. J Transl Med. 2016. PMID: 27495782 Free PMC article.
References
-
- Sreekumar A, Poisson LM, Rajendiran TM, Khan AP, Cao Q, Yu J, Laxman B, Mehra R, Lonigro RJ, Li Y, Nyati MK, Ahsan A, Kalyana-Sundaram S, Han B, Cao X, Byun J, Omenn GS, Ghosh D, Pennathur S, Alexander DC, Berger A, Shuster JR, Wei JT, Varambally C, Beecher C, Chinnaiyan AM. Nature. 2009;457:910–914. - PMC - PubMed
-
- Lewis GD, Wei R, Liu E, Yang E, Shi X, Martinovic M, Farrell L, Asnani A, Cyrille M, Ramanathan A, Shaham O, Berriz G, Lowry PA, Palacios IF, Taşan M, Roth FP, Min J, Baumgartner C, Keshishian H, Addona T, Mootha VK, Rosenzweig A, Carr SA, Fifer MA, Sabatine MS, Gerszten RE. J Clin Invest. 2008;118:3503–3512. - PMC - PubMed
Publication types
MeSH terms
Grants and funding
- U01DK082315/DK/NIDDK NIH HHS/United States
- U01 DK082315/DK/NIDDK NIH HHS/United States
- P30 HL101263-01/HL/NHLBI NIH HHS/United States
- DK20579/DK/NIDDK NIH HHS/United States
- P30 HL101263/HL/NHLBI NIH HHS/United States
- K12 HD001459/HD/NICHD NIH HHS/United States
- P60 DK020579/DK/NIDDK NIH HHS/United States
- P30 DK020579/DK/NIDDK NIH HHS/United States
- U54 AI057160/AI/NIAID NIH HHS/United States
- P41 RR000954/RR/NCRR NIH HHS/United States
- K12 HD001459-09/HD/NICHD NIH HHS/United States
- RR00954/RR/NCRR NIH HHS/United States
- DK5634/DK/NIDDK NIH HHS/United States
LinkOut - more resources
Full Text Sources
Other Literature Sources
Medical
Molecular Biology Databases