. 2011:789:89-110.
doi: 10.1007/978-1-61779-310-3_5.

Intron-specific neuropeptide probes

Affiliations

Intron-specific neuropeptide probes

Harold Gainer et al. Methods Mol Biol. 2011.

Abstract

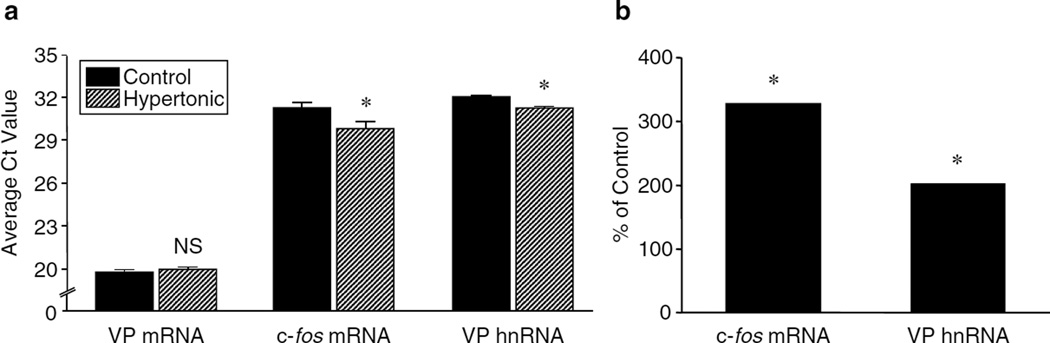
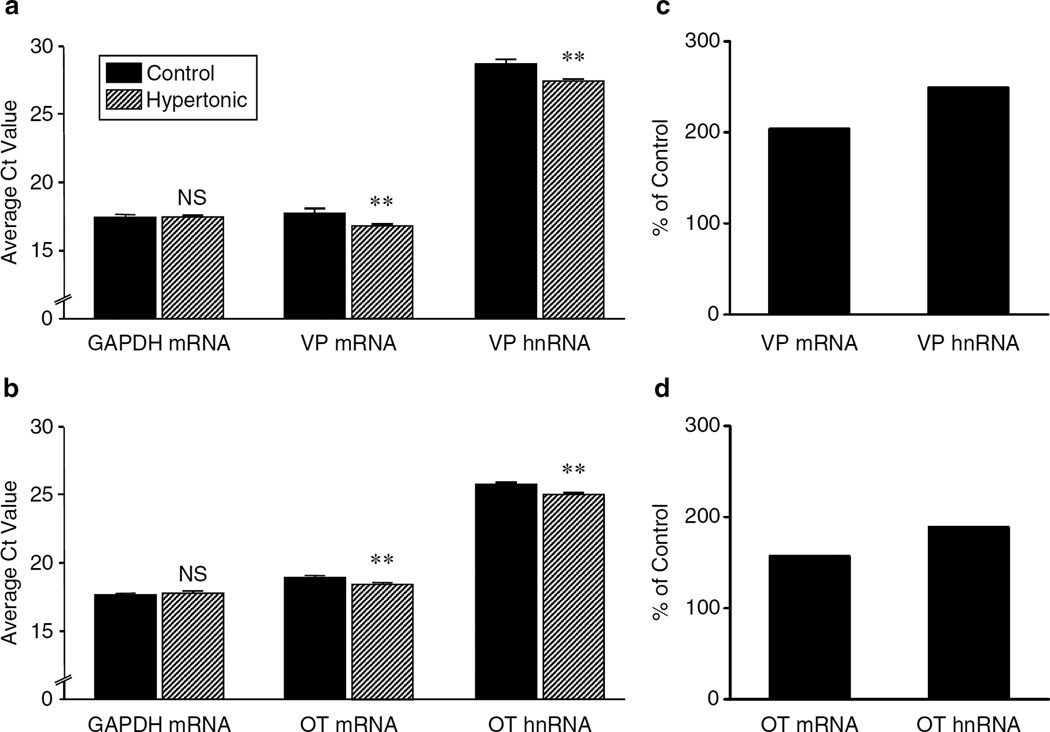
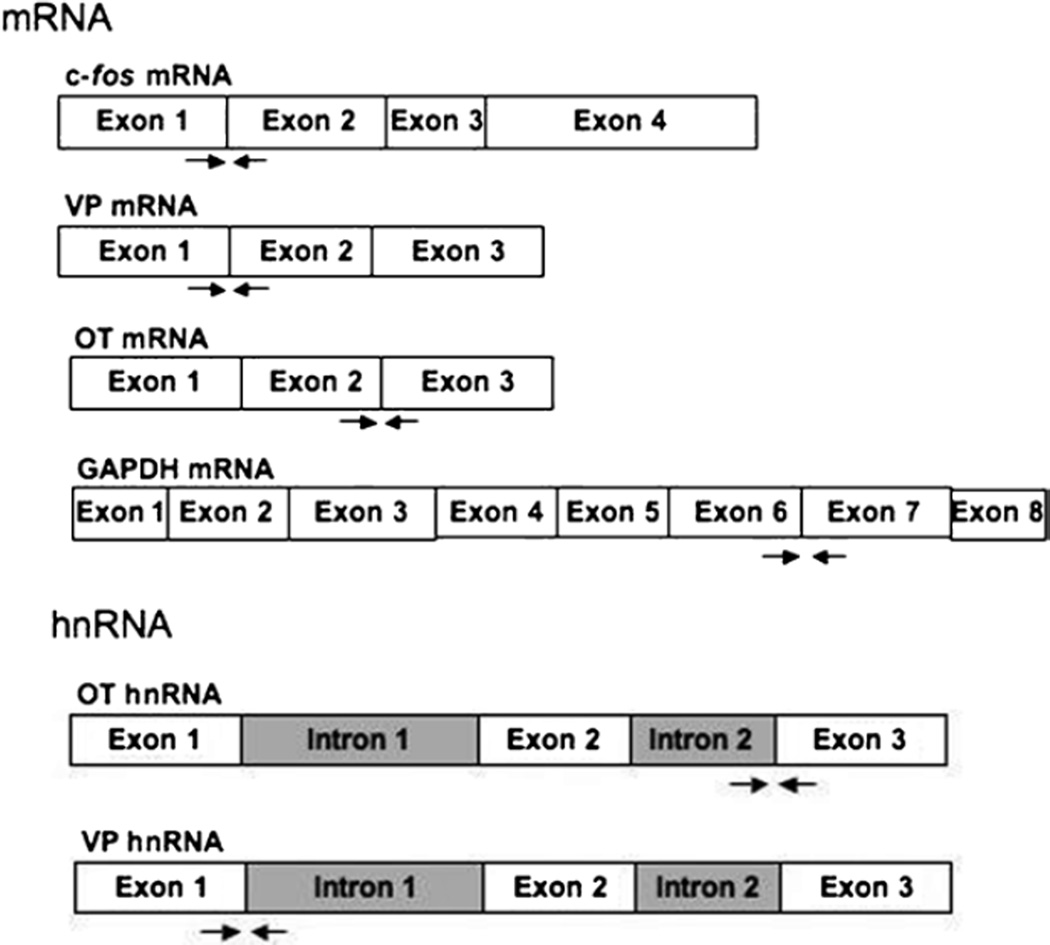
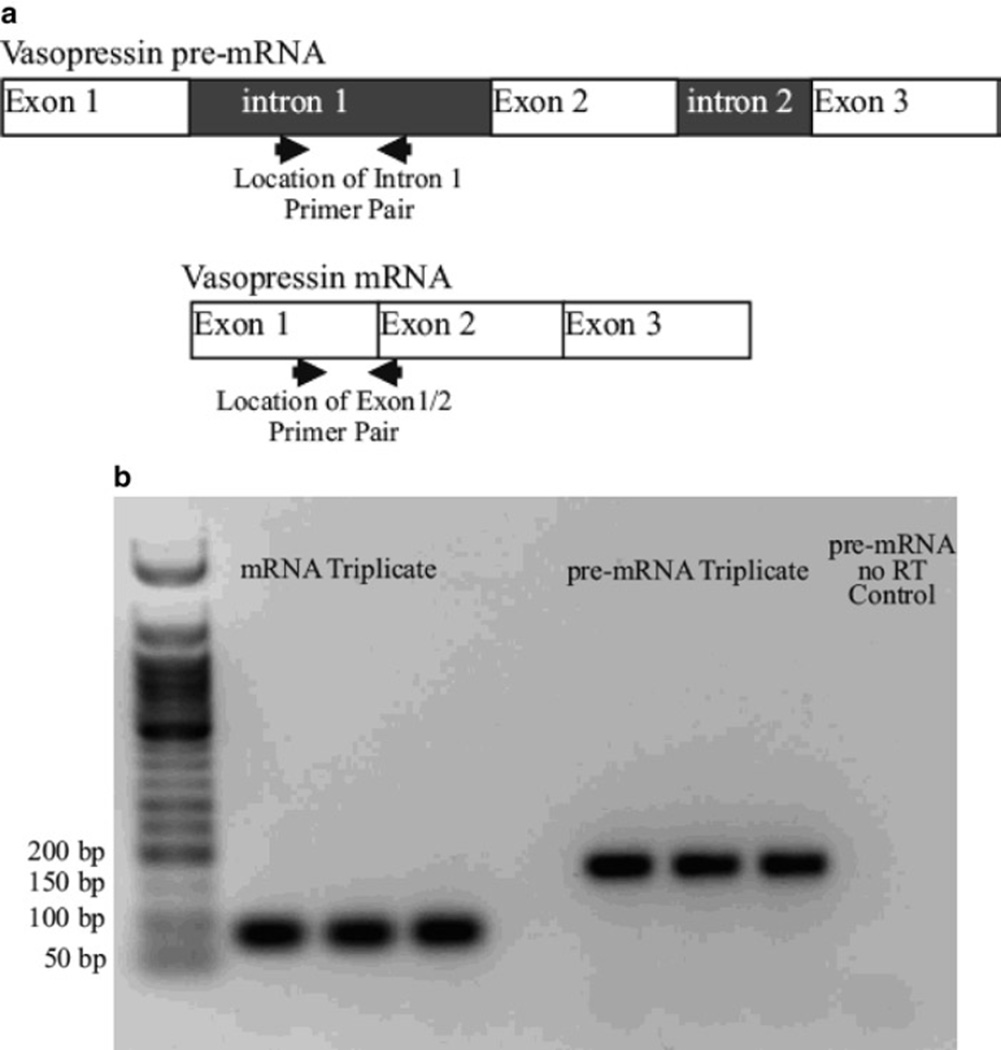
Measurements of changes in pre-mRNA levels by intron-specific probes are generally accepted as more closely reflecting changes in gene transcription rates than are measurements of mRNA levels by exonic probes. This is, in part, because the pre-mRNAs, which include the primary transcript and various splicing intermediates located in the nucleus (also referred to as heteronuclear RNAs, or hnRNAs), are processed rapidly (with half-lives <60 min) as compared to neuropeptide mRNAs, which are then transferred to the cytoplasm and which have much longer half-lives (often over days). In this chapter, we describe the use of exon-and intron-specific probes to evaluate oxytocin (OT) and vasopressin (VP) neuropeptide gene expression by analyses of their mRNAs and hnRNAs by quantitative in situ hybridization (qISH) and also by using specific PCR primers in quantitative, real-time PCR (qPCR) procedures.


Figures

Fig. 1
Fig. 1
Photomicrograph of ISHH of VP mRNAs and hnRNAs in rat brain sections at two different anatomic levels of hypothalamus. Two top panels illustrate VP mRNAs by hybridization with VP exon-specific probe. The VP mRNA levels in the SON appear to be similar as in the PVN, but significantly greater than in the SCN. Two bottom panels illustrate VP hnRNAs by hybridization with VP intron 1-specific probe. The VP hnRNA levels appear to be quantitatively similar among all these three hypothalamic nuclei. Note that the signal to background ratio is much better for the abundant mRNAs than that for the much less abundant mRNAs (from ref. 19).
Fig. 2
Fig. 2
Representative fluorescence “growth curves” produced by quantitative real-time (qRT) PCR of c-fos mRNA, VP mRNA, and VP hnRNA in the SON in control rats. Locations of the qRT-PCR primers in the RNAs are shown in Fig. 2 (from ref. 22).
Fig. 3
Fig. 3
Changes in Ct values for c-fos mRNA, VP mRNA and VP hnRNA in rat SONs after acute osmotic stimulation as measured by the qRT-PCR assay. (a) Average ± SEM Cycle threshold (Ct) values from control SONs in rats injected with 0.15 M NaCl (black bars) versus SONs in rats injected with 2 M NaCl (stripped bars) are shown. (b) Calculated percent changes in c-fos mRNA and VP hnRNA in the SON 30 min after the injection of hyperosmotic 2 M compared to rats injected with isotonic 0.15 M NaCl injection. Statistically significant differences between Ct values in the 0.15 M and 2 M injected rats are shown by asterisks where P < 0.05 (unpublished data).
Fig. 4
Fig. 4
Changes in Ct values for GAPDH mRNA, VP mRNA, and VP hnRNA in rat SONs after chronic osmotic stimulation as measured by the qRT-PCR assay. (a) Average ± SEM Cycle threshold (Ct) values from control SONs in rats given normal drinking water (black bars) versus SONs in rats given 2.1% NaCl solution ad lib as their only drinking fluid for 5 days (stripped bars) are shown. (b) Changes in Ct values for GAPDH mRNA, OT mRNA, and OT hnRNA in rat SONs after chronic osmotic stimulation as measured by the qRT-PCR assay. (a) Average ± SEM Cycle threshold (Ct) values from control SONs in rats given normal drinking water (black bars) versus SONs in rats given 2.1% NaCl solution ad lib as their only drinking fluid for 5 days (stripped bars) are shown. In (c) are the calculated percent changes in VP mRNA and VP hnRNA in the SON in rats given 2.1% NaCl solution ad lib as their only drinking fluid for 5 days compared to rats given normal drinking water. In (d) the calculated percent changes in OT mRNA and OT hnRNA in the SON in rats given 2.1% NaCl solution ad lib as their only drinking fluid for 5 days compared to rats given normal drinking water. Statistically significant differences between Ct values in the control and 2.1% NaCl given rats are shown by asterisks where P < 0.01 (unpublished data).
Fig. 5
Fig. 5
Locations of qRT-PCR primers in the c-fos mRNA, VP mRNA, VP heteronuclear (hn)RNA, OT mRNA, OT hnRNA and GAPDH mRNA species used for quantitative real-time PCR (qRT-PCR). The arrows depict the positions of forward and reverse PCR primer binding sites (See Table 1 for specific sequences). In single step qPCR, the reverse PCR primer also serves as the primer for reverse transcription.
Fig. 6
Fig. 6
(a) Diagram of VP RNA species and PCR primer binding sites. Top, Pre-mRNA containing both introns and exons. Only the intronic primer pair can bind to this species. Bottom, following the removal of both introns, the exonic regions are joined, thereby allowing the binding of the exonic primer pair. (b) Gel analysis of exonic and intronic PCR products generated from VP mRNA and VP hnRNA from rat supraoptic nucleus. PCR triplicates were subjected to gel electrophoresis on a 2.5% agarose gel containing ethidium bromide. The products are the predicted sizes for the amplicons and are reproducible (modified from ref. 21).

Similar articles

Cited by

  • Vasopressin casts light on the suprachiasmatic nucleus.
    Tsuji T, Allchorne AJ, Zhang M, Tsuji C, Tobin VA, Pineda R, Raftogianni A, Stern JE, Grinevich V, Leng G, Ludwig M. Tsuji T, et al. J Physiol. 2017 Jun 1;595(11):3497-3514. doi: 10.1113/JP274025. Epub 2017 May 14. J Physiol. 2017. PMID: 28402052 Free PMC article.

References

    1. Audibert A, Weil D, Dautry F. In vivo kinetics of mRNA splicing and transport in mammalian cells. Mol. Cell. Biol. 2002;22:6706–6718. - PMC - PubMed
    1. Clement JQ, Qian L, Kaplinsky N, Wilkinson MF. The stability and fate of a spliced intron from vertebrate cells. RNA. 1999;5:206–220. - PMC - PubMed
    1. Hargrove JL. Microcomputer-assisted kinetic modeling of mammalian gene expression. FASEB J. 1993;7:1163–1170. - PubMed
    1. Perry RP, Bard E, Hames BD, Kelly DE, Schibler U. The relationship between hnRNA and mRNA. Prog. Nucleic Acid Res. Mol. Biol. 1976;19:275–292. - PubMed
    1. Fremeau RT, Jr, Lundblad JR, Pritchett DB, Wilcox JN, Roberts JL. Regulation of pro-opiomelanocortin gene transcription in individual cell nuclei. Science. 1986;234:1265–1269. - PubMed

Publication types

LinkOut - more resources