. 2011 Dec;20(12):2013-22.
doi: 10.1002/pro.737. Epub 2011 Oct 19.

Early stages of the recovery stroke in myosin II studied by molecular dynamics simulations

Affiliations

Early stages of the recovery stroke in myosin II studied by molecular dynamics simulations

Andrij Baumketner et al. Protein Sci. 2011 Dec.

Abstract

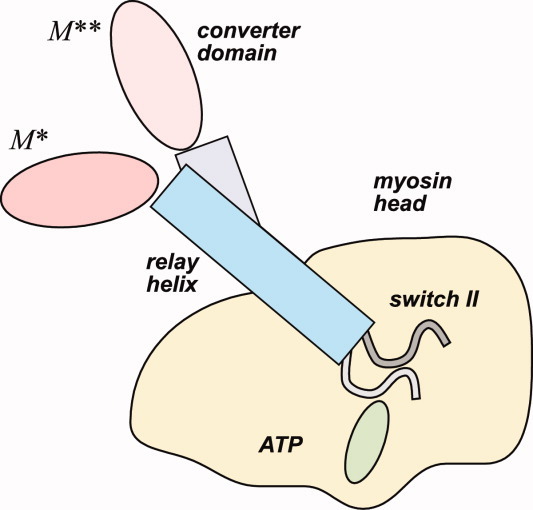
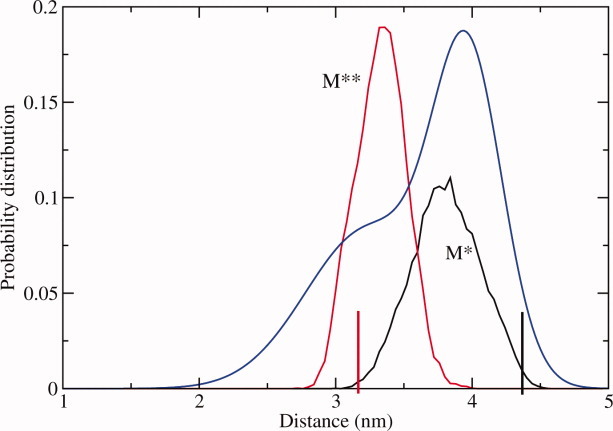
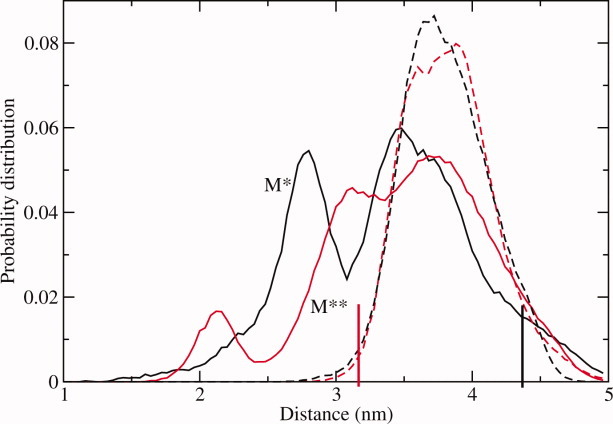
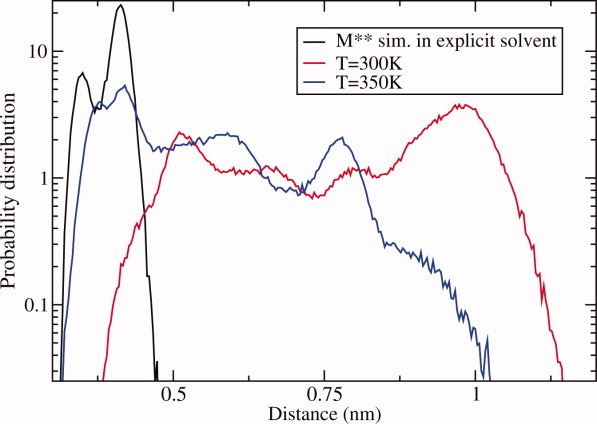
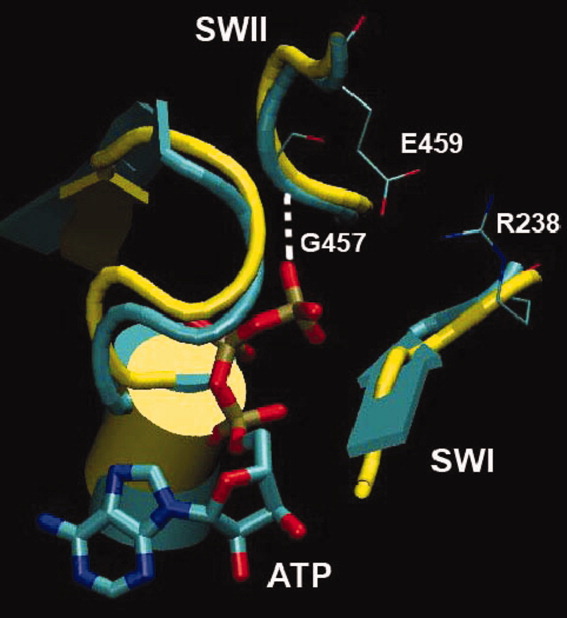
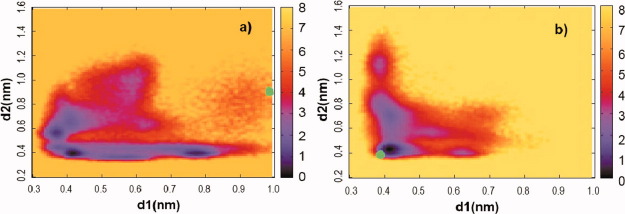
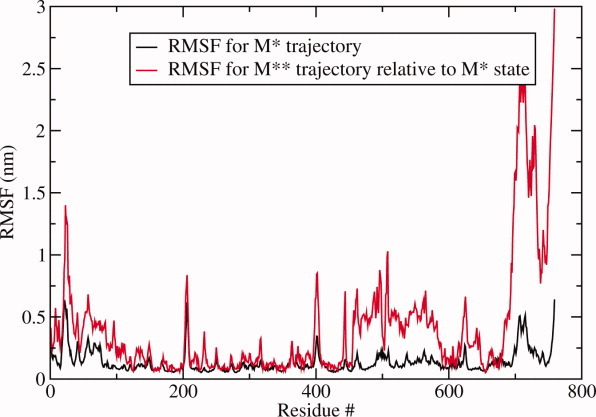
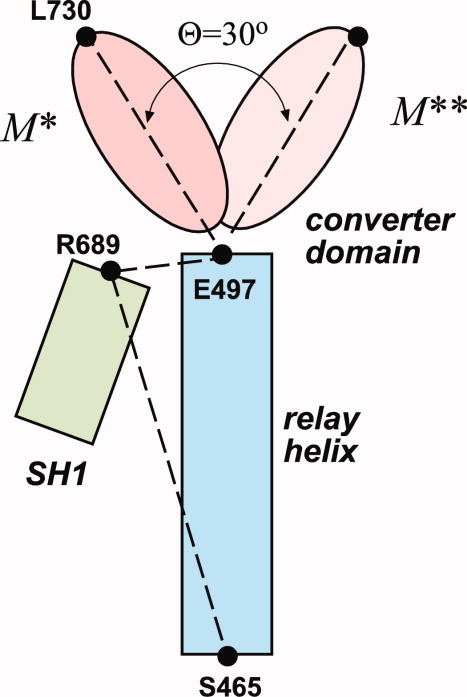
The recovery stroke is a key step in the functional cycle of muscle motor protein myosin, during which pre-recovery conformation of the protein is changed into the active post-recovery conformation, ready to exersice force. We study the microscopic details of this transition using molecular dynamics simulations of atomistic models in implicit and explicit solvent. In more than 2 μs of aggregate simulation time, we uncover evidence that the recovery stroke is a two-step process consisting of two stages separated by a time delay. In our simulations, we directly observe the first stage at which switch II loop closes in the presence of adenosine triphosphate at the nucleotide binding site. The resulting configuration of the nucleotide binding site is identical to that detected experimentally. Distribution of inter-residue distances measured in the force generating region of myosin is in good agreement with the experimental data. The second stage of the recovery stroke structural transition, rotation of the converter domain, was not observed in our simulations. Apparently it occurs on a longer time scale. We suggest that the two parts of the recovery stroke need to be studied using separate computational models.


Figures

Figure 1
Figure 1
Cartoon explaining two alternative structural states of ATP-bound myosin: pre-recovery stroke state M* and post-recovery state M**. SWII loop is open in M* state. Its closure triggers a cascade of conformational changes that result in bending of the relay helix and rotation of the converter domain in M** state. [Color figure can be viewed in the online issue, which is available at wileyonlinelibrary.com.]
Figure 2
Figure 2
Probability distribution functions for the distance between Nζ atom of K498 and Cβ atom of A639 observed in explicit solvent simulations at T = 300 K. Vertical lines correspond to the initial values of the distance in crystallographic M* and M** states. Blue line is the experimental EPR interprobe distance distribution. [Color figure can be viewed in the online issue, which is available at wileyonlinelibrary.com.]
Figure 3
Figure 3
Same as Figure 2 but for implicit solvent modeling at T = 350 K, solid lines, and T = 300 K, broken lines. [Color figure can be viewed in the online issue, which is available at wileyonlinelibrary.com.]
Figure 4
Figure 4
Distribution function of the distance between N atom of G457 and Pγ of ATP molecule. Black line: simulations in explicit solvent started from M** structural state with the SWII closed. Colored lines are for implicit solvent simulations started from M* state with the switch open. Red line: T = 300 K, blue line: T = 350 K. Spontaneous closure of the switch is seen at T = 350 K temperature only. [Color figure can be viewed in the online issue, which is available at wileyonlinelibrary.com.]
Figure 5
Figure 5
Conformation of the ATP binding pocket. Yellow: crystallographic M** structure, cyan: high-temperature implicit solvent simulations. Hydrogen bond between G457 and ATP and a salt bridge between E459 and R238 are observed in both structures. [Color figure can be viewed in the online issue, which is available at wileyonlinelibrary.com.]
Figure 6
Figure 6
2D free energy map observed in implicit solvent simulations at T = 350 K for (a) pre-recovery state M* and (b) post-recovery state M**. The order parameters d1 and d2 characterize the state of SWII and the R238–E459 salt bridge and are defined as the distance between atoms G457:N and ATP:Pγ and R238:Cζ and E459:Cδ. The green circles represent initial configurations with SWII open and salt bridge absent in (a) and SWII closed and salt bridge present in (b). Although the most stable configuration is with SWII closed and the salt bridge formed, the two events are not strongly correlated. Energy in all free energy graphs in this work is given in kT where k is the Boltzmann constant. [Color figure can be viewed in the online issue, which is available at wileyonlinelibrary.com.]
Figure 7
Figure 7
Root-mean-square fluctuations (RMSF) measured for Cα atoms. Black line: values obtained for the M* trajectory in explicit solvent with respect to the average structure after aligning all timeframes to M* conformation. Red line: the same quantity for M** trajectory computed relative to M* conformation after alignment along residues 100–400. Converter domain is seen as the region in which greatest divergence occurs. [Color figure can be viewed in the online issue, which is available at wileyonlinelibrary.com.]
Figure 8
Figure 8
Cartoon defining the dihedral angle θ we use in this work to distinguish M* and M** states. The angle is formed by the line passing through Cα atoms of E497 and L730 with the plane formed by Cα atoms of E497, R689, and S465. [Color figure can be viewed in the online issue, which is available at wileyonlinelibrary.com.]
Figure 9
Figure 9
Estimate obtained from the implicit solvent M* simulations for free energy as a function of two order parameters: RMSD deviation from M** state over Cα of residues 484–512 and the angle θ characterizing the rotation state of the converter domain. Contours show the location of M** and M* states as seen in explicit solvent simulations. No global M* to M** transition is observed. Free energy is measured in units of kT, where k is the Boltzmann constant. [Color figure can be viewed in the online issue, which is available at wileyonlinelibrary.com.]

Similar articles

Cited by

References

    1. Lymn RW, Taylor EW. Mechanism of adenosine triphosphate hydrolysis by actomyosin. Biochemistry. 1971;10:4617–4624. - PubMed
    1. Malnasi-Csizmadia A, Pearson DS, Kovacs M, Woolley RJ, Geeves MA, Bagshaw CR. Kinetic resolution of a conformational transition and the ATP hydrolysis step using relaxation methods with a Dictyostelium myosin II mutant containing a single tryptophan residue. Biochemistry. 2001;40:12727–12737. - PubMed
    1. Agafonov RV, Nesmelov YE, Titus MA, Thomas DD. Muscle and nonmuscle myosins probed by a spin label at equivalent sites in the force-generating domain. Proc Natl Acad Sci USA. 2008;105:13397–13402. - PMC - PubMed
    1. Gyimesi M, Kintses B, Bodor A, Perczel A, Fischer S, Bagshaw CR, Malnasi-Csizmadia A. The mechanism of the reverse recovery step, phosphate release, and actin activation of Dictyostelium myosin II. J Biol Chem. 2008;283:8153–8163. - PubMed
    1. Sweeney HL, Houdusse A. Structural and functional insights into the myosin motor mechanism. Annu Rev Biophys. 2010;39:539–557. - PubMed

Publication types

LinkOut - more resources