. 2011 Nov;179(5):2199-209.
doi: 10.1016/j.ajpath.2011.07.030. Epub 2011 Sep 13.

Egr-1 expression during neointimal development in flow-associated pulmonary hypertension

Affiliations

Egr-1 expression during neointimal development in flow-associated pulmonary hypertension

Michael G Dickinson et al. Am J Pathol. 2011 Nov.

Abstract

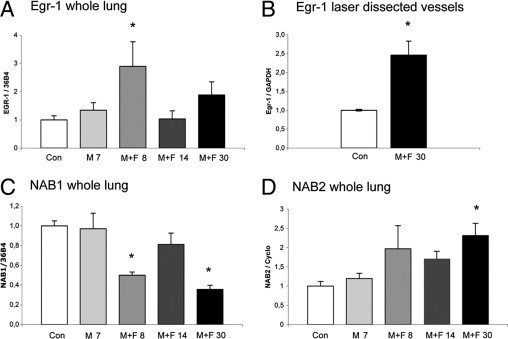
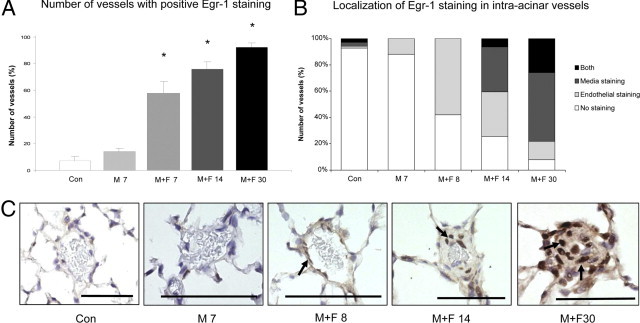
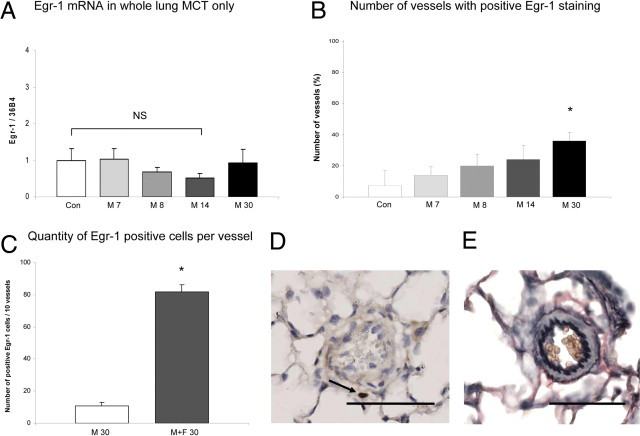
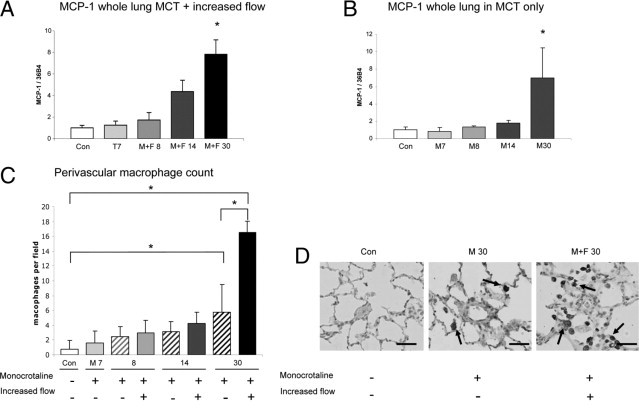
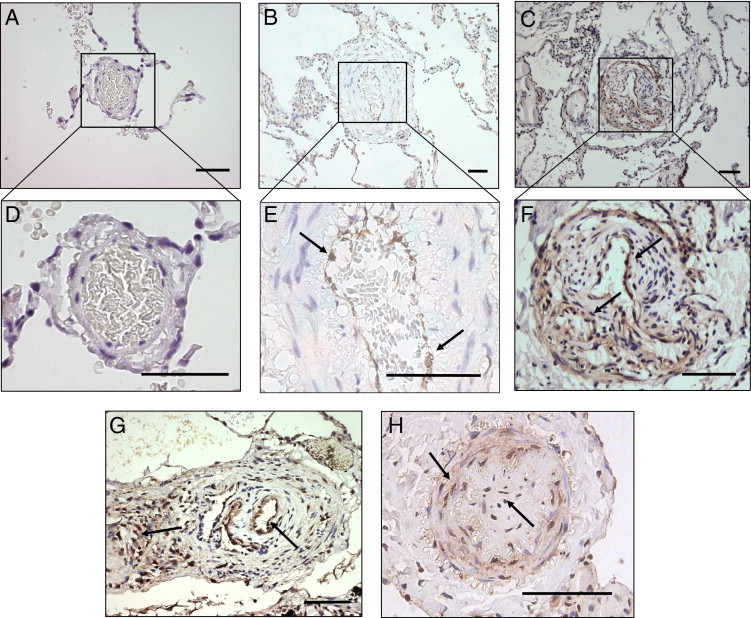
In flow-associated pulmonary arterial hypertension (PAH), increased pulmonary blood flow is an essential trigger for neointimal formation. Using microarray analysis, we recently found that the early growth response protein 1 (Egr-1) transcription factor is increased in experimental flow-associated end-stage PAH. Its role in PAH development is unknown. Here, we assessed the spatiotemporal expression of Egr-1 during neointimal development in flow-associated PAH. Flow-associated PAH was produced in rats by combining monocrotaline administration with an aortocaval shunt. Animals were sacrificed 1 day before or 1 day, 1 week, or 4 to 5 weeks after flow addition. Egr-1 expression was spatiotemporally assessed using laser microdissection, quantitative real-time PCR and immunohistochemistry. In addition, Egr-1 expression was assessed in a non-neointimal pulmonary hypertension model and in human PAH associated with congenital shunt. In 4 to 5 weeks, rats subjected to increased flow developed PAH with neointimal lesions. Egr-1 mRNA was increased 1 day after flow addition and in end-stage PAH, whereas monocrotaline only did not result in increased Egr-1 mRNA. Directly after flow addition, Egr-1 was expressed in endothelial cells. During disease development, Egr-1 protein expression increased and migrated throughout the vessel wall. In PAH patients, Egr-1 was expressed in vessels with media hypertrophy and neointimal lesions, including plexiform lesions. Thus, Egr-1 may be an important regulator in the development of pulmonary neointimal lesions induced by increased pulmonary blood flow.


Figures

Figure 1
Figure 1
Development of pulmonary vascular remodeling and neointimal lesions. A: Occlusion percentage of the intra-acinar vessels per experimental group (Materials and Methods). B: Muscularization per experimental group: percentage of intra-acinar vessels per degree of muscularization (including neointimal lesions). C: Typical examples (original magnification, ×400) of intra-acinar vessels per experimental group stained with Verhoeff. Note at M+F 30 the neointimal lesion with destruction of inner elastic membrane and disorganized cell proliferation. D: Typical examples of immunofluorescence double staining (original magnification, ×400) of intra-acinar vessels per experimental group: anti-SMA (red; smooth muscle cells), anti–von Willebrand factor (green; endothelial cells), and Dako (blue; nuclei). Note at M+F 30 luminal obstruction due to endothelial proliferation. Data are presented as mean ± SEM. *P < 0.05 versus controls. CON, pooled sham groups. Scale bar = 50 μm.
Figure 2
Figure 2
mRNA expression during pulmonary vascular remodeling in flow-associated PAH. A: Egr-1 expression relative to 36B4 per experimental group in whole lung. Bars indicate mRNA increase compared with controls. Expression levels in the control group are set to 1. Bars indicate mRNA increase compared with controls. B: Egr-1 expression relative to GAPDH in laser-dissected intra-acinar vessels at M+F 30 compared with laser-dissected intra-acinar vessels of controls. NAB1 expression relative to 36B4 (C) and NAB2 relative to cyclophilin (D) per experimental group in whole lung. Data are presented as mean ± SEM. *P < 0.05 versus controls. CON, pooled sham groups.
Figure 3
Figure 3
Egr-1 staining in intra-acinar vessels in flow-associated PAH. A: Percentage of intra-acinar vessels staining positive for Egr-1 per experimental group. B: Localization of Egr-1 staining in intra-acinar vessels per experimental group. C: Typical examples (original magnification, ×400) of Egr-1 staining (arrows) in intra-acinar vessels per experimental group. Note that Egr-1 staining is located in endothelial cells 1 day after flow addition (T8). During disease development, Egr-1 staining is seen in the intima and media layer with strong Egr-1 staining in neointimal lesions. Data are presented as mean ± SEM. *P < 0.05 versus controls. CON, pooled sham groups. Scale bar = 50 μm.
Figure 4
Figure 4
Egr-1 expression during pulmonary vascular remodeling in non-neointimal PH. To further emphasize the relationship among increased flow, Egr-1 up-regulation, and neointimal development, we investigated Egr-1 expression in a non-flow, non-neointmal PAH model (monocrotaline-only rats). See detailed description in Materials and Methods. A: Egr-1 expression relative to 36B4 per experimental group in whole lung. Bars indicate mRNA increase compared with controls. Expression levels in the control group are set to 1. Egr-1 mRNA expression is not up-regulated in whole lung in monocrotaline-induced vascular remodeling. B: Percentage of intra-acinar vessels staining positive for Egr-1 per experimental group. The number of vessels that show positive Egr-1 staining is increased in the M 30 group (*P < 0.05 versus controls). However, this number is far less compared with the number of vessels in the M+F 30 group as seen in Figure 3A. Also the number of positive Egr-1 cells per vessel in the end-stage groups differ (C). In addition, localization of Egr-1 staining differed in the M 30 group compared with M+F 30 group as seen in D. Typical example (original magnification, ×400) of Egr-1 staining in the M 30 group where Egr-1 staining was mainly found perivascularly. E: Typical example (original magnification, ×400) a Verhoeff staining of a peri-acinar vessel with media hypertrophy seen in the M 30 group. Administration of monocrotaline only never resulted in neointimal formation at M 30. Data are presented as mean ± SEM. *P < 0.05 versus controls. CON, pooled sham groups Scale bar = 50 μm.
Figure 5
Figure 5
MCP-1 expression and macrophage infiltration during pulmonary vascular remodeling. MCP-1 expression relative to 36B4 per experimental group in whole lung of the M+F (A) and M (B) groups. Bars indicate mRNA increase compared with controls. Expression levels in the control group are set to 1. Bars indicate mRNA increase compared with controls. C: Perivascular macrophage count per field at ×400 magnification. D: Typical examples (original magnification, ×400) of CD68+ staining. Note the marked increase in macrophage infiltration around the neointimal lesion in the M+F 30 group compared with a normal vessel in the control group and a vessel with media hypertrophy in the M 30 group. Data are presented as mean ± SEM. *P < 0.05 versus controls. CON, pooled sham groups. Scale bar = 50 μm.
Figure 6
Figure 6
Egr-1 staining in human PAH lesions. A: Egr-1 staining of a normal lung vessel from a control subject free of lung disease (original magnification, ×200). B: Egr-1 staining of vessel with media hypertrophy in PAH patient associated with a congenital cardiac shunt (original magnification, ×200). C: Egr-1 staining of plexiform lesion in PAH patient associated with a congenital cardiac shunt (original magnification, ×200). D: Enlarged view of the same vessel in A, showing no Egr-1 staining. E: Enlarged view of the same vessel in B, showing marked Egr-1 staining in the endothelial layer. F: Enlarged view of the plexiform lesion in C, showing Egr-1 staining mainly in endothelial cells bordering the lumen (arrows). G: Egr-1 staining of a larger plexiform lesion (original magnification, ×100) showing as similar pattern of Egr-1 expression (arrows) compared with F. H: Egr-1 staining of a concentric intima lesion with diffuse staining throughout the vessel wall. Scale bar = 100 μm.

References

    1. Berger R.M. Possibilities and impossibilities in the evaluation of pulmonary vascular disease in congenital heart defects. Eur Heart J. 2000;21:17–27. - PubMed
    1. Wagenvoort C.A., Mooi W.J. In: Munro Neville A., Walker F., Gottlieb L.S., editors. Chapman and Hall Medical; London: 1989. Biopsy pathology of the pulmonary vasculature; pp. 56–113.
    1. Sakao S., Tatsumi K., Voelkel N.F. Reversible or irreversible remodeling in pulmonary arterial hypertension. Am J Respir Cell Mol Biol. 2010;43:629–634. - PMC - PubMed
    1. Humbert M., Morrell N.W., Archer S.L., Stenmark K.R., MacLean M.R., Lang I.M., Christman B.W., Weir E.K., Eickelberg O., Voelkel N.F., Rabinovitch M. Cellular and molecular pathobiology of pulmonary arterial hypertension. J Am Coll Cardiol. 2004;43:13S–24S. - PubMed
    1. Chan S.Y., Loscalzo J. Pathogenic mechanisms of pulmonary arterial hypertension. J Mol Cell Cardiol. 2008;44:14–30. - PMC - PubMed

MeSH terms