. 2012 Jan 1;226(1):133-46.
doi: 10.1016/j.bbr.2011.09.009. Epub 2011 Sep 12.

Dendritic morphology of amygdala and hippocampal neurons in more and less predator stress responsive rats and more and less spontaneously anxious handled controls

Affiliations

Dendritic morphology of amygdala and hippocampal neurons in more and less predator stress responsive rats and more and less spontaneously anxious handled controls

Robert Adamec et al. Behav Brain Res. .

Abstract

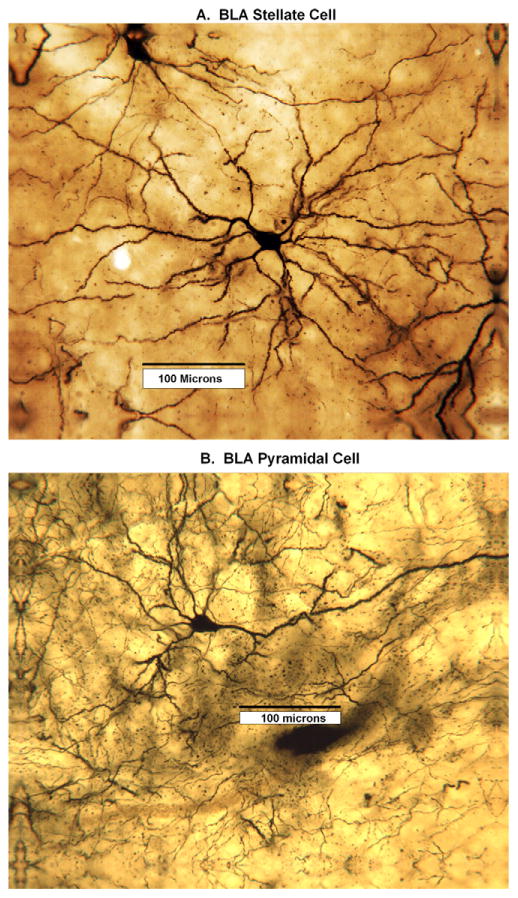
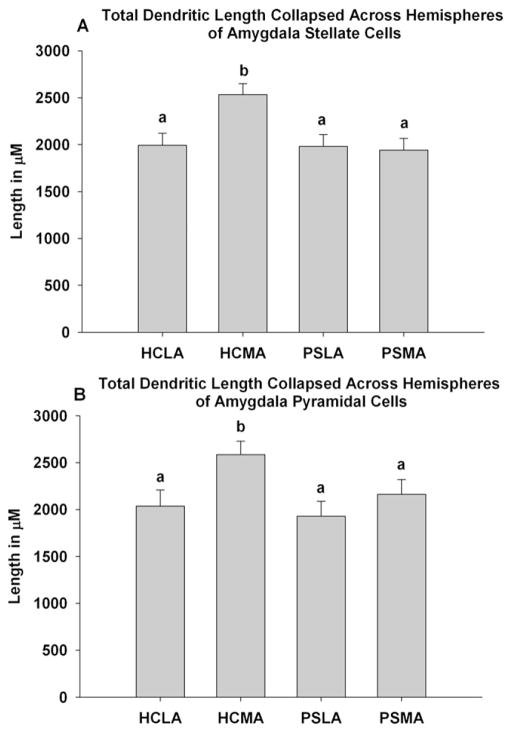
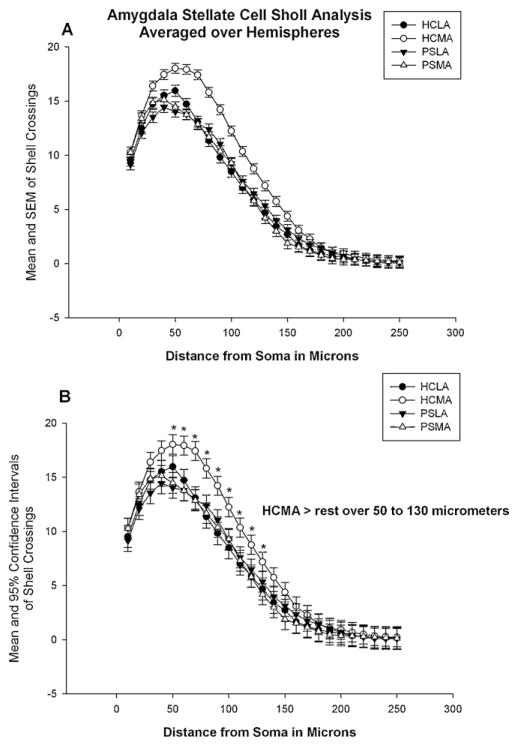
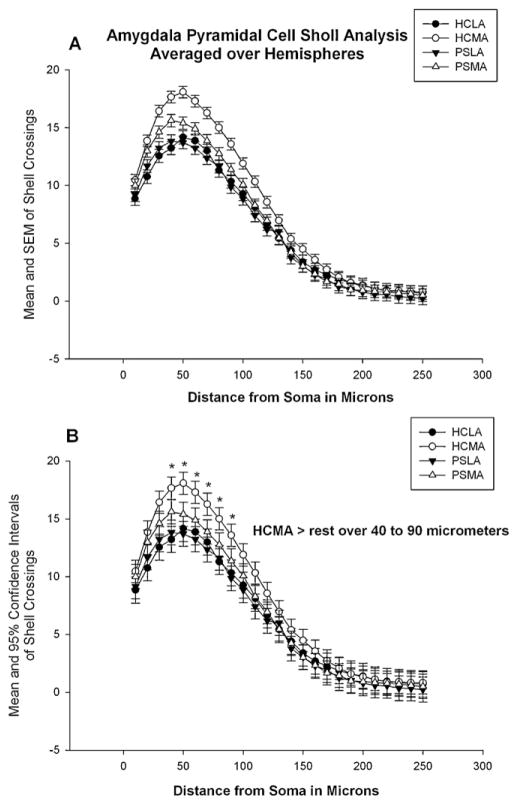
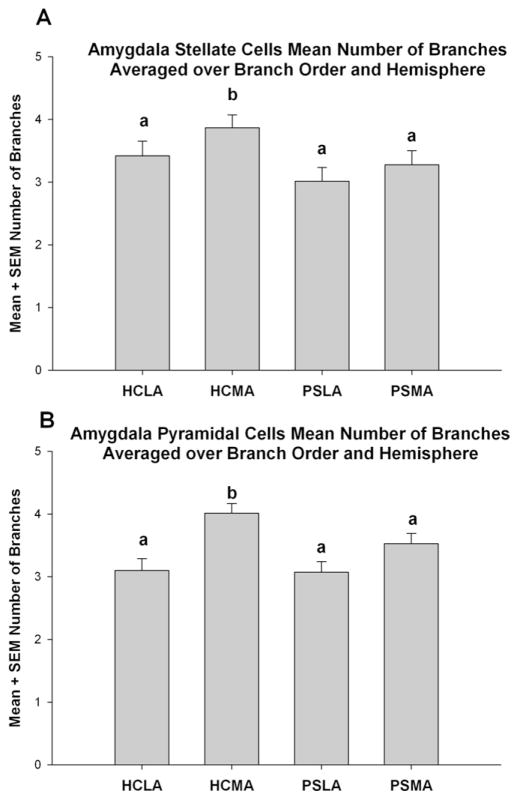
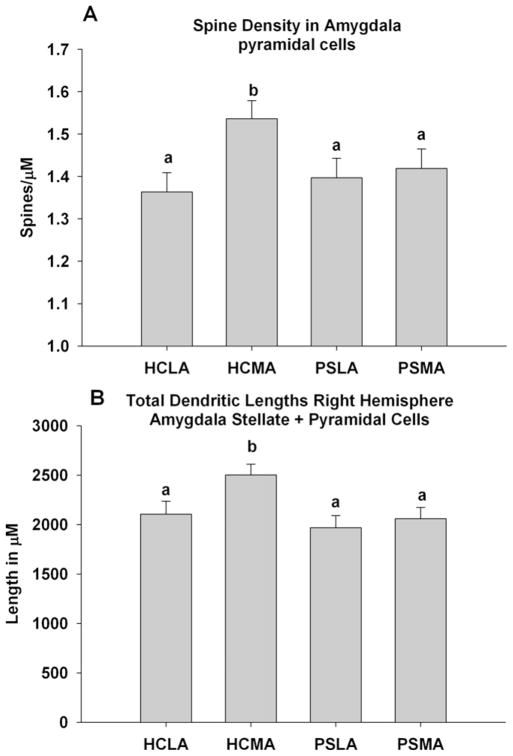
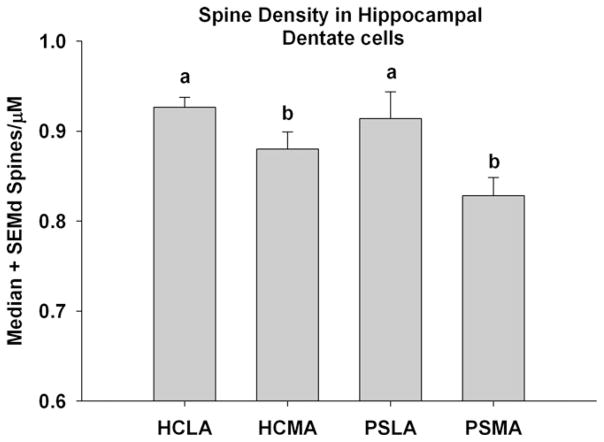
We investigated the neurobiological bases of variation in response to predator stress (PS). Sixteen days after treatment (PS or handling), rats were grouped according to anxiety in the elevated plus maze (EPM). Acoustic startle was also measured. We examined the structure of dendritic trees of basolateral amygdala (BLA) output neurons (stellate and pyramidal cells) and of dorsal hippocampal (DHC) dentate granule cells of less anxious (LA) and more (extremely) anxious (MA) stressed animals (PSLA and PSMA). Handled controls (HC) which were less anxious (HCLA) and spontaneously more anxious (HCMA) equivalently to predator stressed subgroups were also studied. Golgi analysis revealed BLA output neurons of HCMA rats exhibited longer, more branched dendrites with higher spine density than the other groups of rats, which did not differ. Finally, spine density of DHC granule cells was equally depressed in HCMA and PSMA rats relative to HCLA and PSLA rats. Total dendritic length of BLA pyramidal and stellate cells (positive predictor) and DHC spine density (negative predictor) together accounted for 96% of the variance of anxiety of handled rats. DHC spine density was a negative predictor of PSMA and PSLA anxiety, accounting for 70% of the variance. Data are discussed in the context of morphological differences as phenotypic markers of a genetic predisposition to anxiety in handled controls, and a possible genetic vulnerability to predator stress expressed as reduced spine density in the DHC. Significance of findings for animal models of anxiety and hyperarousal comorbidities of PTSD are discussed.


Figures

Fig 1
Fig 1
(A) A photomicrograph of a Golgi stained stellate cell of the basolateral amygdala (BLA). (B) A photomicrograph of a Golgi stained pyramidal cell of the basolateral amygdala (BLA).
Fig 2
Fig 2
(A) A photomicrograph of a Golgi stained dentate granule cell of the dorsal hippocampus. (B) Photomicrograph of Golgi stained dentate granule cell spines of the dorsal hippocampus of a handled less anxious (HCLA top) rat and of a handled more anxious (HCMA bottom) rat.
Fig 3
Fig 3
(A) Plotted across all handled controls (HC), and all predator stressed (PS) rats are mean + SEM of behaviors measured in the EPM (ratio time, ratio entry and the anxiety index – anxiety which is 1 − (ratio time + ratio entry/2)). (B) Plotted as in (A) are mean + SEM of behaviors measured in the EPM. Here the influence of closed arm entries has been removed with analysis of covariance. (C) Mean + SEM of closed arm entries in the EPM are plotted for all handled controls (HC) and all predator stressed rats (PS). Within a given behavioral plot in (A–C), means marked differently differ.
Fig 4
Fig 4
Plotted in (A and B) are mean + SEM of behaviors in the hole board for all handled controls (HC) and all predator stressed rats (PS). (A) shows mean + SEM of measures of exploration (head dips) and activity (rears) in the hole board test. (B) shows mean + SEM of time spent in the center and time spent near the walls of the hole board. Within a given behavioral plot in (A and B), means marked differently differ and unmarked means do not differ.
Fig 5
Fig 5
(A) Plotted are mean + SEM of the anxiety index of less anxious (LA – less EPM anxiety) and more anxious (MA – more EPM anxiety) rats selected for Golgi analysis in the Handled Controls and Predator Stressed groups. Means marked similarly do not differ while means marked differently differ. (B) Plotted are mean + SEM of closed arm entries in the EPM of less anxious (LA – less EPM Anxiety) and more anxious (MA – more EPM anxiety) rats selected for Golgi analysis in the Handled Controls and Predator Stressed groups. In this plot means marked differently differ, means marked the same do not differ. (C). Plotted are mean + SEM of the anxiety index of less anxious (LA – less EPM anxiety) and more anxious (MA– more EPM anxiety) rats selected for Golgi analysis in the Handled Controls and Predator Stressed groups. Means are those observed after the influence of closed arm entries is removed with analysis of covariance. Means marked similarly do not differ while means marked differently differ.
Fig 6
Fig 6
(A) Plotted are median + SEMd of peak startle amplitude (in volts) of less anxious (LA – less EPM anxiety) and more anxious (MA – more EPM anxiety) rats selected for Golgi analysis in the Handled Controls and Predator Stressed groups. Medians marked similarly do not differ while medians marked differently differ. (B) Plotted are Tau + SE of trials to decline to 37% of the maximum of peak startle amplitude of less anxious (LA – less EPM anxiety) and more anxious (MA – more EPM anxiety) rats selected for Golgi analysis in the Handled Controls and Predator Stressed groups. Tau values marked similarly do not differ while Tau values marked differently differ.
Fig 7
Fig 7
Plotted are mean + SEM of total dendritic length (mM) collapsed across hemispheres. Plotted separately are Handled Controls which are less anxious (HCLA) or more anxious (HCMA) and Predator Stressed rats which are less anxious (PSLA) or more anxious (PSMA). (A) shows data from basolateral amygdala stellate cells while data from pyramidal cells appear in (B). For a given plot (A or B) means marked similarly do not differ, while means marked differently differ.
Fig 8
Fig 8
Plotted are mean shell crossings vs distance from the soma of the crossings from the Sholl analysis of basolateral amygdala stellate cells collapsed across hemispheres. Plotted separately are Handled Controls which are less anxious (HCLA) or more anxious (HCMA) and Predator Stressed rats which are less anxious (PSLA) or more anxious (PSMA). (A) shows mean ± SEM, while (B) shows mean ± 95% confidence intervals of shell crossings. In (B), HCMA means marked with an “*” differ from the remaining groups which do not differ. This occurs over a range from the soma of 50–130 μM.
Fig 9
Fig 9
Plotted are mean shell crossings vs distance from the soma of the crossings from the Sholl analysis of basolateral amygdala pyramidal cells collapsed across hemispheres. Plotted separately are Handled Controls which are less anxious (HCLA) or more anxious (HCMA) and Predator Stressed rats which are less anxious (PSLA) or more anxious (PSMA). (A) shows mean ± SEM, while (B) shows mean ± 95% confidence intervals of shell crossings. In (B), HCMA means marked with an “*” differ from the remaining groups which do not differ. This occurs over a range from the soma of 40–90 μM.
Fig 10
Fig 10
Plotted are mean + SEM of number of branches in the branch point analysis collapsed across hemispheres and branch order. Plotted separately are Handled Controls which are less anxious (HCLA) or more anxious (HCMA) and Predator Stressed rats which are less anxious (PSLA) or more anxious (PSMA). (A) shows data from basolateral amygdala stellate cells while data from pyramidal cells appear in (B). For a given figure (A or B) means marked similarly do not differ, while means marked differently differ.
Fig 11
Fig 11
(A) Plotted are mean + SEM of spine densities (spines/μM) of basolateral amygdala pyramidal cells collapsed across hemispheres and basilar and apical dendrites. Plotted separately are Handled Controls which are less anxious (HCLA) or more anxious (HCMA) and Predator Stressed rats which are less anxious (PSLA) or more anxious (PSMA). Means marked similarly do not differ, while means marked differently differ. (B) Plotted are mean + SEM of total dendritic length (μM) of basolateral amygdala stellate and pyramidal cells combined from the right hemisphere. Plotted separately are Handled Controls which are less anxious (HCLA) or more anxious (HCMA) and Predator Stressed rats which are less anxious (PSLA) or more anxious (PSMA). Means marked similarly do not differ, while means marked differently differ.
Fig 12
Fig 12
Plotted are median + SEMd of spine densities (spines/mM) of dentate granule cells of the dorsal hippocampus collapsed across hemispheres. Plotted separately are Handled Controls which are less anxious (HCLA) or more anxious (HCMA) and Predator Stressed rats which are less anxious (PSLA) or more anxious (PSMA). Medians marked similarly do not differ, while medians marked differently differ.

References

    1. Stam R. PTSD and stress sensitisation: a tale of brain and body Part 1: human Studies. Neurosci Biobehav Rev. 2007;31(4):530–57. - PubMed
    1. Kessler RC, Berglund P, Demler O, Jin R, Merikangas KR, Walters EE. Lifetime prevalence and age-of-onset distributions of DSM-IV disorders in the National Comorbidity Survey Replication. Arch Gen Psychiatry. 2005;62(6):593–602. - PubMed
    1. Kessler RC, Sonnega A, Bromet E, Hughes M, Nelson CB. Posttraumatic stress disorder in the National Comorbidity Survey. Arch Gen Psychiatry. 1995;52(12):1048–60. - PubMed
    1. Heinrichs M, Wagner D, Schoch W, Soravia LM, Hellhammer DH, Ehlert U. Predicting posttraumatic stress symptoms from pretraumatic risk factors: a 2-year prospective follow-up study in firefighters. Am J Psychiatry. 2005;162(12):2276–86. - PubMed
    1. McNally RJ. Psychological mechanisms in acute response to trauma. Biol Psychiatry. 2003;53(9):779–88. - PubMed

Publication types