

An enzymatic colorimetric assay for glucose-6-phosphate
- PMID: 21925475
- PMCID: PMC3195850
- DOI: 10.1016/j.ab.2011.08.037
An enzymatic colorimetric assay for glucose-6-phosphate
Abstract
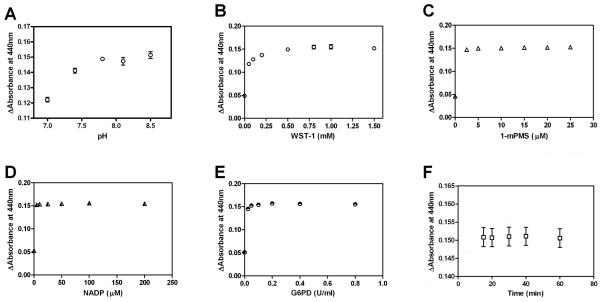
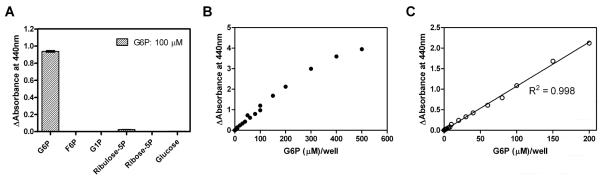
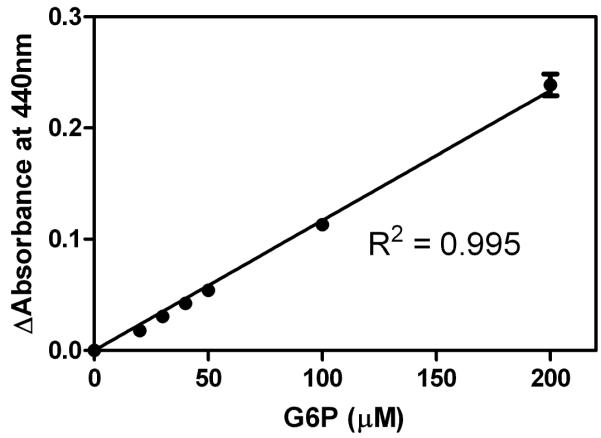
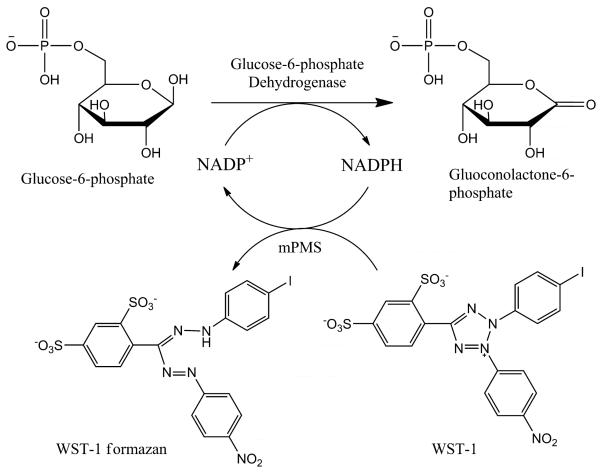
A specific colorimetric assay for the determination of glucose-6-phosphate (G6P) was developed. This assay is based on the oxidation of G6P in the presence of glucose-6-phosphate dehydrogenase (G6PD) and nicotinamide adenine dinucleotide phosphate (NADP(+)); the NADPH thereby generated reduces the tetrazolium salt WST-1 [2-(4-indophenyl)-3-(4-nitrophenyl)-5-(2,4-disulfophenyl)-2H tetrazolium, monosodium salt] to water-soluble yellow-colored formazan with 1-methoxy-5-methylphenazium methylsulfate (1-mPMS) as an electron carrier. The assay is optimized for reaction buffer pH, enzyme/dye concentration, and reaction time course. The limit of detection of the assay is 0.15 μM (15 pmol/well). The usefulness of the assay is demonstrated by the accurate measurement of the G6P concentration in fetal bovine serum (FBS).
Copyright © 2011 Elsevier Inc. All rights reserved.
Figures
Similar articles
-
A new colorimetric assay for sensitive detection of glucose-6-phosphate dehydrogenase deficiency based on silver nanoparticles.Nanotechnology. 2021 Nov 12;33(5). doi: 10.1088/1361-6528/ac2fe5. Nanotechnology. 2021. PMID: 34649232
-
An enzymatic fluorimetric assay for glucose-6-phosphate: application in an in vitro Warburg-like effect.Anal Biochem. 2009 May 1;388(1):97-101. doi: 10.1016/j.ab.2009.02.009. Epub 2009 Feb 10. Anal Biochem. 2009. PMID: 19454216 Free PMC article.
-
A novel quantitative histochemical assay to measure endogenous substrate concentrations in tissue sections. Fundamental aspects.Acta Histochem. 1995 Oct;97(4):409-19. doi: 10.1016/S0065-1281(11)80066-8. Acta Histochem. 1995. PMID: 8607291
-
Real-time monitoring of glucose-6-phosphate dehydrogenase activity using liquid droplet arrays and its application to human plasma samples.Biosens Bioelectron. 2016 May 15;79:930-7. doi: 10.1016/j.bios.2016.01.034. Epub 2016 Jan 13. Biosens Bioelectron. 2016. PMID: 26802575
-
Glucose-6-phosphate dehydrogenase from Leuconostoc mesenteroides. Conformational transitions induced by nicotinamide adenine dinucleotide, nicotinamide adenine dinucleotide phosphate, and glucose 6-phosphate monitored by fluorescent probes.Biochemistry. 1982 Dec 7;21(25):6421-8. doi: 10.1021/bi00268a016. Biochemistry. 1982. PMID: 7150565 No abstract available.
Cited by
-
Polymerization in the actin ATPase clan regulates hexokinase activity in yeast.Science. 2020 Feb 28;367(6481):1039-1042. doi: 10.1126/science.aay5359. Science. 2020. PMID: 32108112 Free PMC article.
-
Modulation of glucose-related metabolic pathways controls glucose level in airway surface liquid and fight oxidative stress in cystic fibrosis cells.J Bioenerg Biomembr. 2019 Jun;51(3):203-218. doi: 10.1007/s10863-019-09797-5. Epub 2019 Apr 27. J Bioenerg Biomembr. 2019. PMID: 31030390
-
Immobilized Enzymes in Biosensor Applications.Materials (Basel). 2019 Jan 2;12(1):121. doi: 10.3390/ma12010121. Materials (Basel). 2019. PMID: 30609693 Free PMC article. Review.
-
Starch phosphorylation regulates starch granule morphological homogeneity in Arabidopsis thaliana.Plant Physiol. 2024 Mar 29;194(4):2600-2615. doi: 10.1093/plphys/kiad656. Plant Physiol. 2024. PMID: 38060678 Free PMC article.
-
Fibroblasts Mobilize Tumor Cell Glycogen to Promote Proliferation and Metastasis.Cell Metab. 2019 Jan 8;29(1):141-155.e9. doi: 10.1016/j.cmet.2018.08.007. Epub 2018 Aug 30. Cell Metab. 2019. PMID: 30174305 Free PMC article.
References
-
- Berg JM, Tymoczko JL, Stryer L. Biochemistry. W.H. Freeman; New York: 2007.
-
- Aiston S, Andersen B, Agius L. Glucose 6-phosphate regulates hepatic glycogenolysis through inactivation of phosphorylase. Diabetes. 2003;52:1333–1339. - PubMed
-
- Quain DE, Haslam JM. Changes in glucose-6-phosphate and storage carbohydrates during catabolite derepression in Saccharomyces cerevisiae. J Gen Microbiol. 1979;113:195–198.
-
- Buchholz A, Takors R, Wandrey C. Quantification of intracellular metabolites in Escherichia coli K12 using liquid chromatographic-electrospray ionization tandem mass spectrometric techniques. Anal Biochem. 2001;295:129–137. - PubMed
Publication types
MeSH terms
Substances
Grants and funding
LinkOut - more resources
Full Text Sources
Miscellaneous
