Improving measurement of functional connectivity through decreasing partial volume effects at 7 T
- PMID: 21925611
- PMCID: PMC3254819
- DOI: 10.1016/j.neuroimage.2011.08.096
Improving measurement of functional connectivity through decreasing partial volume effects at 7 T
Abstract
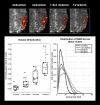
Several applications of fMRI at high field have taken advantage of the increased BOLD contrast to increase spatial resolution, but the potential benefits of higher fields for detecting and analyzing functional connectivity have largely been unexplored. We measured the influence of spatial resolution at 7 T on estimates of functional connectivity through decreased partial volume averaging. Ten subjects were imaged at 7 T with a range of spatial resolutions (1×1×2 mm to 3×3×2 mm) during performance of a finger tapping task and in the resting state. We found that resting state correlations within the sensory-motor system increase as voxel dimensions decreased from 3×3×2 mm to 1×1×2 mm, whereas connectivity to other brain regions was unaffected. This improvement occurred even as overall signal to noise ratios decrease. Our data suggest that this increase may be due to decreased partial volume averaging, and that functional connectivity within the primary seed region is heterogeneous on the scale of single voxels.
Copyright © 2011 Elsevier Inc. All rights reserved.
Figures


Similar articles
-
Measuring functional connectivity using MEG: methodology and comparison with fcMRI.Neuroimage. 2011 Jun 1;56(3):1082-104. doi: 10.1016/j.neuroimage.2011.02.054. Epub 2011 Feb 23. Neuroimage. 2011. PMID: 21352925 Free PMC article.
-
Functional connectivity as revealed by spatial independent component analysis of fMRI measurements during rest.Hum Brain Mapp. 2004 Jul;22(3):165-78. doi: 10.1002/hbm.20022. Hum Brain Mapp. 2004. PMID: 15195284 Free PMC article.
-
Estimation of resting-state functional connectivity using random subspace based partial correlation: a novel method for reducing global artifacts.Neuroimage. 2013 Nov 15;82:87-100. doi: 10.1016/j.neuroimage.2013.05.118. Epub 2013 Jun 5. Neuroimage. 2013. PMID: 23747287 Free PMC article.
-
Biophysical and neural basis of resting state functional connectivity: Evidence from non-human primates.Magn Reson Imaging. 2017 Jun;39:71-81. doi: 10.1016/j.mri.2017.01.020. Epub 2017 Feb 2. Magn Reson Imaging. 2017. PMID: 28161319 Free PMC article. Review.
-
The role of physiological noise in resting-state functional connectivity.Neuroimage. 2012 Aug 15;62(2):864-70. doi: 10.1016/j.neuroimage.2012.01.016. Epub 2012 Jan 8. Neuroimage. 2012. PMID: 22245341 Review.
Cited by
-
Ultra-high field MRI reveals mood-related circuit disturbances in depression: a comparison between 3-Tesla and 7-Tesla.Transl Psychiatry. 2019 Feb 15;9(1):94. doi: 10.1038/s41398-019-0425-6. Transl Psychiatry. 2019. PMID: 30770788 Free PMC article.
-
Evaluation of a multiple spin- and gradient-echo (SAGE) EPI acquisition with SENSE acceleration: applications for perfusion imaging in and outside the brain.Magn Reson Imaging. 2014 Dec;32(10):1171-80. doi: 10.1016/j.mri.2014.08.032. Epub 2014 Aug 29. Magn Reson Imaging. 2014. PMID: 25179133 Free PMC article.
-
Fine-scale functional connectivity in somatosensory cortex revealed by high-resolution fMRI.Magn Reson Imaging. 2011 Dec;29(10):1330-7. doi: 10.1016/j.mri.2011.08.001. Epub 2011 Oct 6. Magn Reson Imaging. 2011. PMID: 21982165 Free PMC article.
-
A precision functional atlas of personalized network topography and probabilities.Nat Neurosci. 2024 May;27(5):1000-1013. doi: 10.1038/s41593-024-01596-5. Epub 2024 Mar 26. Nat Neurosci. 2024. PMID: 38532024 Free PMC article.
-
The Effect of Gray Matter ICA and Coefficient of Variation Mapping of BOLD Data on the Detection of Functional Connectivity Changes in Alzheimer's Disease and bvFTD.Front Hum Neurosci. 2017 Jan 9;10:680. doi: 10.3389/fnhum.2016.00680. eCollection 2016. Front Hum Neurosci. 2017. PMID: 28119587 Free PMC article.
References
-
- Alexander AL, Hasan KM, Lazar M, Tsuruda JS, Parker DL. Analysis of partial volume effects in diffusion-tensor MRI. Magn Reson Med. 2001;45:770–780. - PubMed
-
- Bullmore E, Brammer M, Rouleau G, Everitt B, Simmons A, Sharma T, Frangou S, Murray R, Dunn G. Computerized brain tissue classification of magnetic resonance images: a new approach to the problem of partial volume artifact. Neuroimage. 1995;2:133–147. - PubMed
-
- Fazio F, Perani D. Importance of partial-volume correction in brain PET studies. J Nucl Med. 2000;41:1849–1850. - PubMed
Publication types
MeSH terms
Substances
Grants and funding
LinkOut - more resources
Full Text Sources
Medical

