. 2012 Jan;40(2):553-68.
doi: 10.1093/nar/gkr752. Epub 2011 Sep 16.

Modeling the relative relationship of transcription factor binding and histone modifications to gene expression levels in mouse embryonic stem cells

Affiliations

Modeling the relative relationship of transcription factor binding and histone modifications to gene expression levels in mouse embryonic stem cells

Chao Cheng et al. Nucleic Acids Res. 2012 Jan.

Abstract

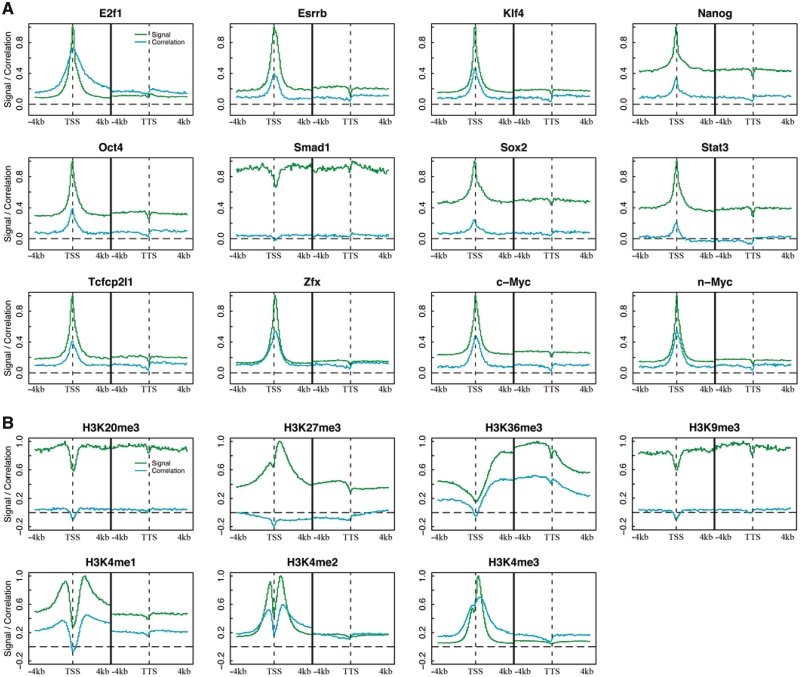
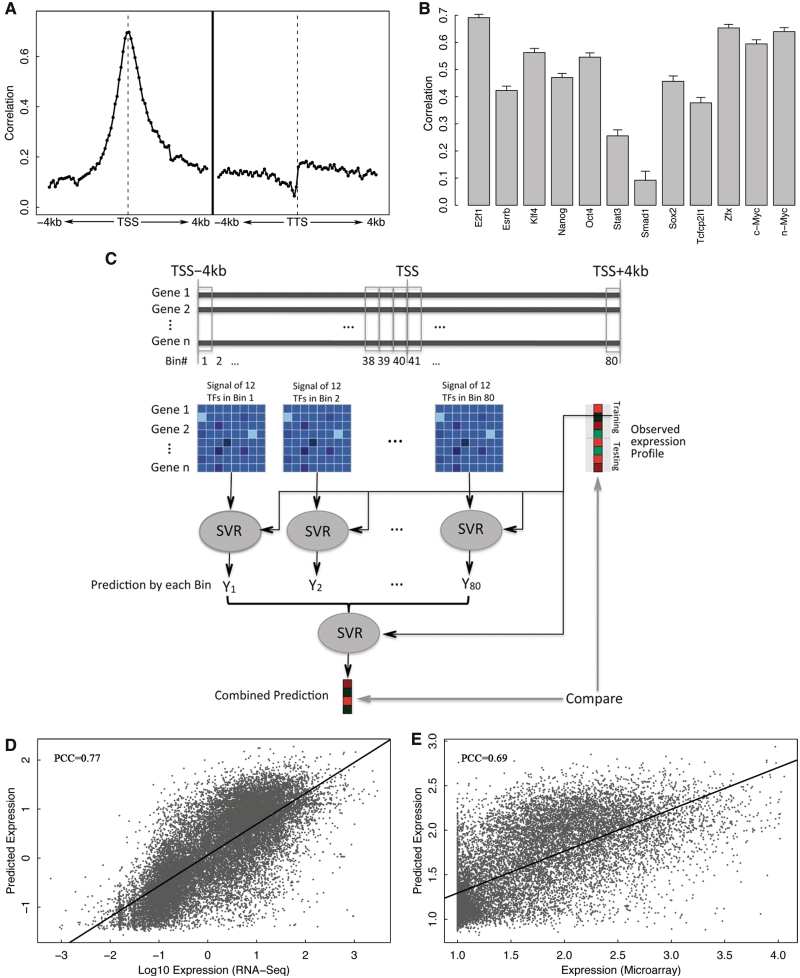
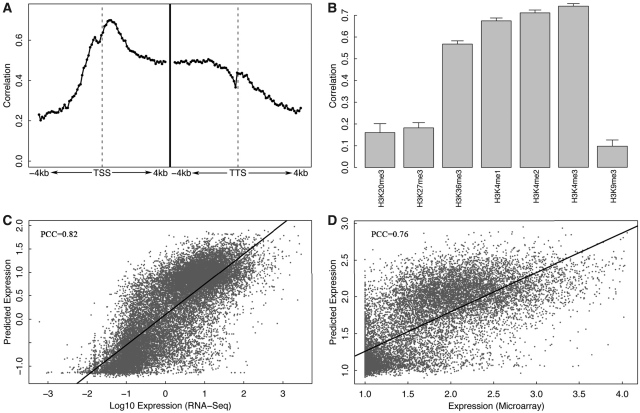
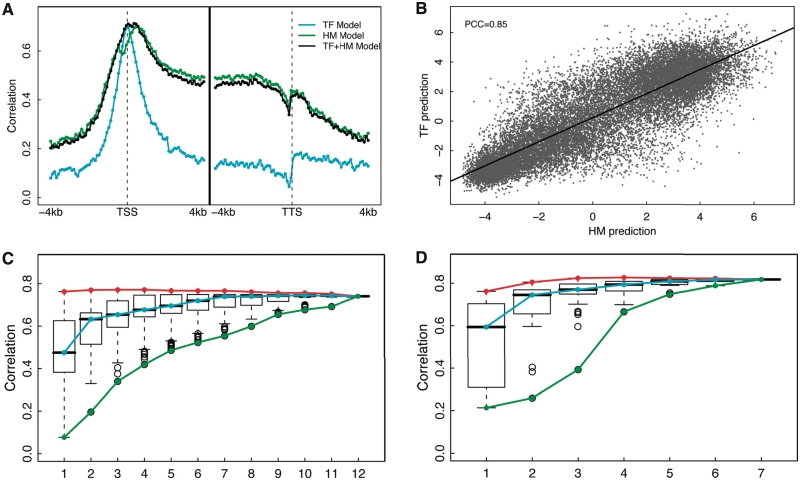
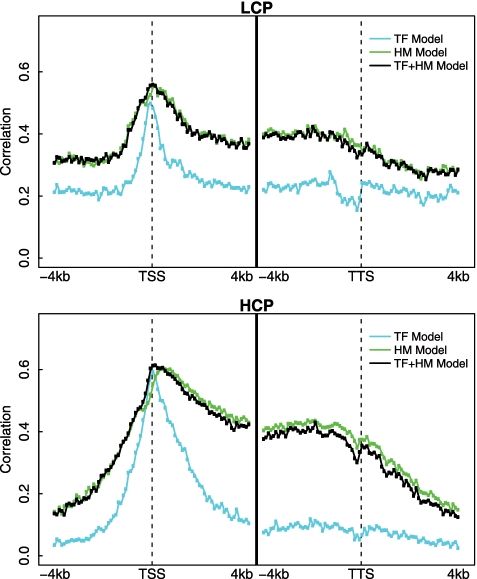
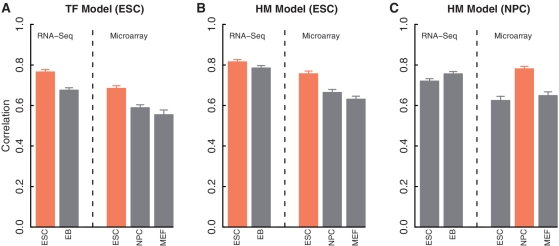
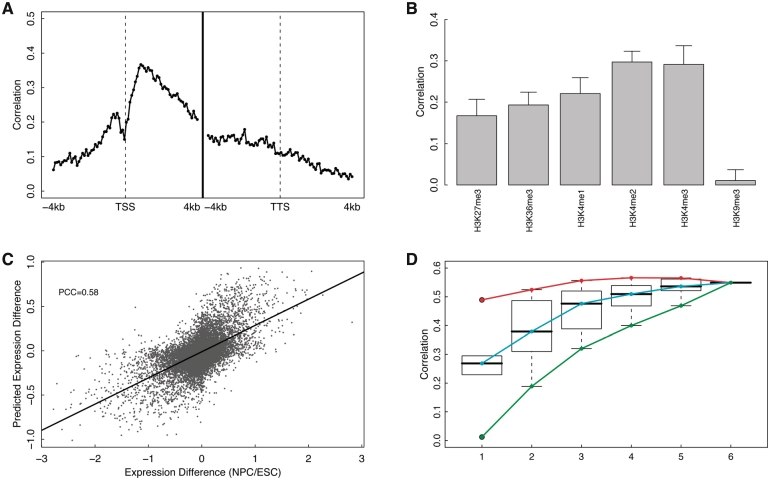
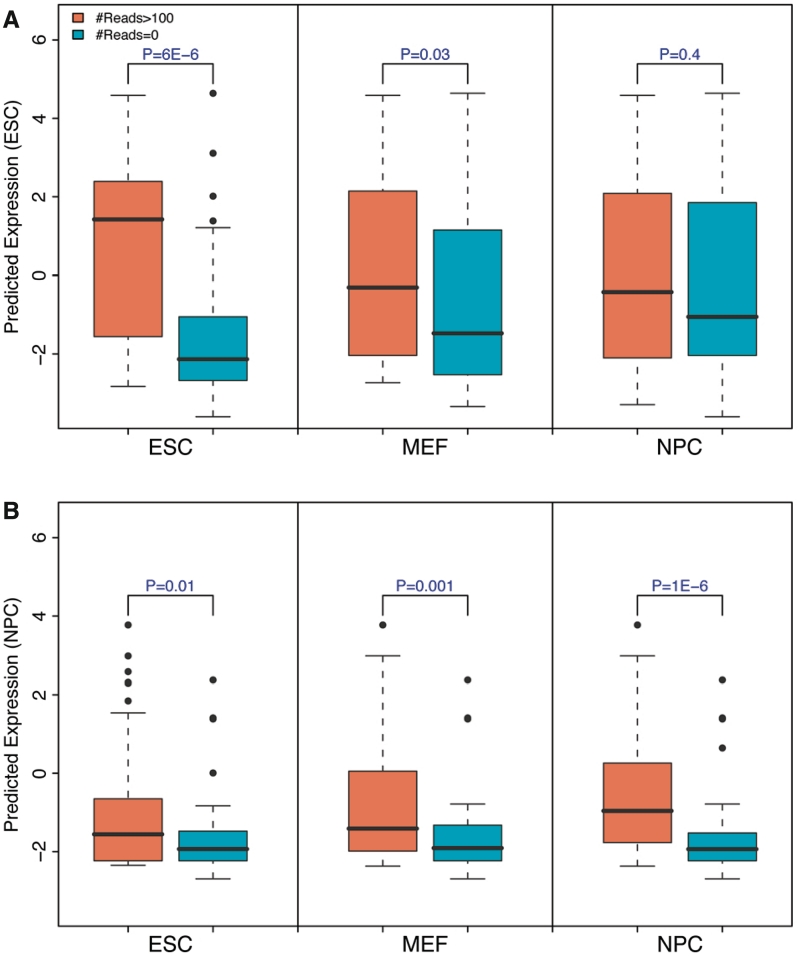
Transcription factor (TF) binding and histone modification (HM) are important for the precise control of gene expression. Hence, we constructed statistical models to relate these to gene expression levels in mouse embryonic stem cells. While both TF binding and HMs are highly 'predictive' of gene expression levels (in a statistical, but perhaps not strictly mechanistic, sense), we find they show distinct differences in the spatial patterning of their predictive strength: TF binding achieved the highest predictive power in a small DNA region centered at the transcription start sites of genes, while the HMs exhibited high predictive powers across a wide region around genes. Intriguingly, our results suggest that TF binding and HMs are redundant in strict statistical sense for predicting gene expression. We also show that our TF and HM models are cell line specific; specifically, TF binding and HM are more predictive of gene expression in the same cell line, and the differential gene expression between cell lines is predictable by differential HMs. Finally, we found that the models trained solely on protein-coding genes are predictive of expression levels of microRNAs, suggesting that their regulation by TFs and HMs may share a similar mechanism to that for protein-coding genes.


Figures

Figure 1.
Figure 1.
Signal distribution and correlation pattern of TFs (A) and histone marks (B) around TSS and TTS. DNA regions around TSS and TTS (−4 to ∼4 kb) of genes were divided into100-nt bins. Signal distribution (green curves) was calculated by averaging signal across all genes in each bin. Correlation pattern (cyan curves) was obtained by correlating signal with expression levels across all genes. The black line at the center of each plot separates TSS and TTS regions.
Figure 2.
Figure 2.
TF model for gene expression prediction in ESC. (A) Prediction accuracy of each of 160 bins around TSS or TTS (−4 to 4 kb). In each bin, expression levels are predicted using SVR based on binding signal of 12 TFs. (B) Individual predictive power of the 12 TFs. For each TF, expression levels are predicted using SVR based on signal in all bins. (C) A two-layer TF model. Expression levels are first predicted using TF-binding signals in 80 bins and then the predicted values are integrated in the second layer to make final predictions. SVR method is applied in both layers. (D) Prediction results of the two-layer model for RNA-Seq expression data. (E) Prediction results of the two-layer model for microarray expression data.
Figure 3.
Figure 3.
HM model for gene expression prediction in ESC. (A) Prediction accuracy of each of 160 bins around TSS or TTS −4 to 4 kb). In each bin, expression levels are predicted using SVR based on signal of seven HMs. (B) Individual predictive power of the seven HMs. For each HM, expression levels are predicted using SVR based on signal in all bins. (C) Prediction results of the two-layer HM model for RNA-Seq expression data. (D) Prediction results of the two-layer HM model for microarray expression data. The prediction powers of H3K36me3, H3K4me1, H3K4me2 and H3K4me3 are significantly higher than those of H3K20me3, H3K27me3 and H3K9me3 (P < 0.001, t-test).
Figure 4.
Figure 4.
Redundancy of the TF and the HM models in ESC. (A) The prediction accuracy of three models: the TF model, the HM model and a combined TF+HM model, in each of the 160 bins. (B) Consistency between TF model predictions and HM model predictions. The predicted expression values were based on the two-layer TF model (y-axis) and the two-layer model (x-axis). (C) Distribution of prediction accuracies of all m-TF models with m taken from 1 to 12. (D) Distribution of prediction accuracies of all m-HM models with m taken from 1 to 7. The maximum, the median and the minimum prediction accuracy for m-TF (C) or m-HM (D) models are connected by the red, cyan and green curves, respectively. In (C) and (D), the maximum signals for TF binding or HMs across the 160 bins were used as the predictors.
Figure 5.
Figure 5.
Predicting the expression level of genes with LCP and HCP promoters.
Figure 6.
Figure 6.
Cell line specificity of the TF and the HM models. (A) TF models based on TF-binding data in ESC for predicting expression levels from RNA-Seq in ESC and EB, and from microarrays in ESC, NPC and MEF. (B) Similar to the Left, but for HM models. (C) Similar to the Middle, but the HM models are based on HMs in NPC. For all models, the prediction accuracies are estimated from the cross-validation results of 100 re-sampled data sets. The cell line matched models are highlighted in yellow color. In all groups, the predictions are more accurate for the matched cell line (yellow bars) than for the others (gray bars) (P < 0.001) according to t-test.
Figure 7.
Figure 7.
HM model for predicting differential gene expression in NPC versus ESC. (A) Prediction accuracy of each of 160 bins around TSS or TTS (−4 to 4 kb). In each bin, log ratios of gene expression for NPC/ESC are predicted using SVR based on signal differences of six HMs between the two cell lines. (B) Individual predictive power of the six HMs. For each HM, expression levels are predicted using SVR based on difference of the modification in all bins. (C) Prediction results of the two-layer HM model that combines differential signals of the six HMs in all of the 160 bins. (D) Distribution of prediction accuracies of all m-HM models with m taken from 1 to 6. The maximum, the median and the minimum prediction accuracy for the m-HM models are connected by the red, cyan and green curves, respectively.
Figure 8.
Figure 8.
The HM model is predictive of miRNAs expression with cell line specificity. (A) Distribution of predicted miRNAs expression levels for highly and lowly expressed miRNAs in ESC (left), MEF (middle) and NPC (right). The model is trained on data for protein-coding genes in ESC. (B) Similar to (A), but the model is trained on data in NPC. High and low miRNA groups are determined based on small RNA sequencing data.

References

    1. Farnham PJ. Insights from genomic profiling of transcription factors. Nat. Rev. Genet. 2009;10:605–616. - PMC - PubMed
    1. Berger SL. The complex language of chromatin regulation during transcription. Nature. 2007;447:407–412. - PubMed
    1. Kurdistani SK, Tavazoie S, Grunstein M. Mapping global histone acetylation patterns to gene expression. Cell. 2004;117:721–733. - PubMed
    1. Kouzarides T. Chromatin modifications and their function. Cell. 2007;128:693–705. - PubMed
    1. Li B, Carey M, Workman JL. The role of chromatin during transcription. Cell. 2007;128:707–719. - PubMed

Publication types