. 2011 Oct;121(10):4180-91.
doi: 10.1172/JCI46139. Epub 2011 Sep 19.

Mast cell chymase reduces the toxicity of Gila monster venom, scorpion venom, and vasoactive intestinal polypeptide in mice

Affiliations

Mast cell chymase reduces the toxicity of Gila monster venom, scorpion venom, and vasoactive intestinal polypeptide in mice

Mitsuteru Akahoshi et al. J Clin Invest. 2011 Oct.

Abstract

Mast cell degranulation is important in the pathogenesis of anaphylaxis and allergic disorders. Many animal venoms contain components that can induce mast cell degranulation, and this has been thought to contribute to the pathology and mortality caused by envenomation. However, we recently reported evidence that mast cells can enhance the resistance of mice to the venoms of certain snakes and that mouse mast cell-derived carboxypeptidase A3 (CPA3) can contribute to this effect. Here, we investigated whether mast cells can enhance resistance to the venom of the Gila monster, a toxic component of that venom (helodermin), and the structurally similar mammalian peptide, vasoactive intestinal polypeptide (VIP). Using 2 types of mast cell-deficient mice, as well as mice selectively lacking CPA3 activity or the chymase mouse mast cell protease-4 (MCPT4), we found that mast cells and MCPT4, which can degrade helodermin, can enhance host resistance to the toxicity of Gila monster venom. Mast cells and MCPT4 also can limit the toxicity associated with high concentrations of VIP and can reduce the morbidity and mortality induced by venoms from 2 species of scorpions. Our findings support the notion that mast cells can enhance innate defense by degradation of diverse animal toxins and that release of MCPT4, in addition to CPA3, can contribute to this mast cell function.


Figures

Figure 1
Figure 1. Mast cells can diminish H. suspectum venom–induced (H.s. venom–induced) hypothermia and mortality through MCPT4-dependent mechanisms.
Changes in rectal temperatures after i.d. injection of H. suspectum venom (25 μg in 20 μl DMEM solution) into ear pinnae (1 ear pinna of each mouse). (A) WT WBB6F1-Kit+/+, mast cell–deficient WBB6F1-KitW/W-v, and WT BMCMC→KitW/W-v mice. Death rates of Kit+/+, WT BMCMC→KitW/W-v, and KitW/W-v mice within 24 hours after H. suspectum venom injection were 0% (0/21), 7% (1/15; P = 0.42 versus Kit+/+ mice), and 65% (13/20; P < 0.0001 versus Kit+/+ mice), respectively. (B) WT C57BL/6-Kit+/+, mast cell–deficient C57BL/6-KitW-sh/W-sh, WT BMCMC→KitW-sh/W-sh, and Mcpt4–/– BMCMC→KitW-sh/W-sh mice. Death rates of Kit+/+, WT BMCMC→KitW-sh/W-sh, Mcpt4–/– BMCMC→KitW-sh/W-sh, and KitW-sh/W-sh mice within 24 hours after H. suspectum venom injection were 5% (1/19), 11% (2/18, P = 0.48 versus Kit+/+ mice), 43% (6/14; P = 0.01 versus Kit+/+ mice), and 50% (10/20; P = 0.006 versus Kit+/+ mice), respectively. (C) WT C57BL/6-Kit+/+, C57BL/6-Cpa3Y356L,E378A, and C57BL/6-Mcpt4–/– mice. Death rates of Kit+/+, Cpa3Y356L,E378A, and Mcpt4–/– mice within 24 hours after H. suspectum venom injection were 7% (1/15), 0% (0/14; P = 0.52 versus Kit+/+ mice), and 40% (6/15, P = 0.007 versus Kit+/+ mice), respectively. Each panel shows data pooled from at least 3 independent experiments with each group of mice (n = 2–5 mice per group per experiment). **P < 0.01; ***P < 0.001 versus WT WBB6F1-Kit+/+ or WT C57BL/6-Kit+/+ mice; P < 0.01~0.001 versus each of the other groups (AC). (D) Extensive degranulation of mast cells (some indicated by black arrowheads) 1 hour after i.d. injection of H. suspectum venom (25 μg in 20 μl DMEM), but not vehicle (DMEM) alone (mast cells without evidence of degranulation are indicated by white arrowheads) in WT C57BL/6 mice (toluidine blue stain). Scale bar: 50 μm. (E) Degranulation of mast cells 60 minutes after i.d. injection of H. suspectum venom (25 μg in 20 μl DMEM) or vehicle (DMEM) alone in WT C57BL/6, Mcpt4–/–, or Cpa3Y356L,E378A mice (injection was into 1 ear pinna of each mouse). ***P < 0.001 versus corresponding vehicle-injected groups; NS (P > 0.05) versus values for WT mice. Data are presented as mean ± SEM (AC) or mean + SEM (E).
Figure 2
Figure 2. Mast cells and MCPT4 can diminish helodermin-induced hypothermia and diarrhea in mice.
Changes in rectal temperatures after i.d. injection of helodermin (5 nmol in 20 μl DMEM solution) in ear pinnae (1 ear pinna of each mouse). (A) WT C57BL/6-Kit+/+, C57BL/6-KitW-sh/W-sh, WT BMCMC→KitW-sh/W-sh, and Mcpt4–/– BMCMC→KitW-sh/W-sh mice. The rates of diarrhea within 2 hours after helodermin injection in Kit+/+, WT BMCMC→KitW-sh/W-sh, Mcpt4–/– BMCMC→KitW-sh/W-sh, and KitW-sh/W-sh mice were 20% (2/10), 50% (4/8, P = 0.2 versus Kit+/+ mice), 100% (5/5, P = 0.007 versus Kit+/+ mice), and 100% (11/11, P = 0.0002 versus Kit+/+ mice), respectively. (B) C57BL/6 WT, Cpa3Y356L,E378A, and Mcpt4–/– mice. The rates of diarrhea within 2 hours after helodermin injection in Kit+/+, Cpa3Y356L,E378A, and Mcpt4–/– mice were 22% (2/9), 50% (4/8, P = 0.25 versus Kit+/+ mice), and 100% (9/9, P = 0.001 versus Kit+/+ mice), respectively. *P < 0.05; ***P < 0.001 versus WT Kit+/+ mice; P < 0.05~0.001 versus each of the other groups (A and B). Each panel shows data pooled from at least 3 independent experiments with each group of mice except for Mcpt4–/– BMCMC→KitW-sh/W-sh mice, with which 2 independent experiments were performed (n = 1–3 mice per group per experiment). Data are presented as mean ± SEM.
Figure 3
Figure 3. Mast cells and MCPT4 can diminish VIP-induced hypothermia and diarrhea in mice.
Changes in rectal temperatures after i.d. injection of VIP (5 nmol in 20 μl DMEM solution) in ear pinnae (1 ear pinna of each mouse). (A) WT C57BL/6-Kit+/+, C57BL/6-KitW-sh/W-sh, WT BMCMC→KitW-sh/W-sh, and Mcpt4–/– BMCMC→KitW-sh/W-sh mice. Rates of diarrhea within 2 hours after VIP injection in Kit+/+, WT BMCMC→KitW-sh/W-sh, Mcpt4–/– BMCMC→KitW-sh/W-sh, and KitW-sh/W-sh mice were 13% (1/9), 29% (2/7; P = 0.25 versus Kit+/+ mice), 100% (5/5; P = 0.003 versus Kit+/+ mice), and 100% (9/9; P = 0.0002 versus Kit+/+ mice), respectively. (B) C57BL/6 WT, Cpa3Y356L,E378A, and Mcpt4–/– mice. Rates of diarrhea within 2 hours after VIP injection in Kit+/+, Cpa3Y356L,E378A, and Mcpt4–/– mice were 22% (2/9), 56% (5/9; P = 0.17 versus Kit+/+ mice), and 100% (10/10; P = 0.0007 versus Kit+/+ mice), respectively. ***P < 0.001 versus WT Kit+/+ mice; P < 0.05~0.001 versus each of the other groups (A and B). Each panel shows data pooled from at least 3 independent experiments with each group of mice except for Mcpt4–/– BMCMC→KitW-sh/W-sh mice, with which 2 independent experiments were performed (n = 1–3 mice per group per experiment). Data are presented as mean ± SEM.
Figure 4
Figure 4. Helodermin (Helo) and VIP can activate mast cells at least partly through VIP receptors.
Purified PMCs from WT or Mcpt4–/– mice were incubated with vehicle (Tyrode’s buffer) alone or with the indicated concentrations of helodermin (A), VIP (B), or A23187 calcium ionophore (A23187) (A and B) for 30 minutes at 37°C. Some cells were pretreated with the VIP receptor antagonist VIP6–28. *P < 0.05; **P < 0.01; ***P < 0.001; NS (P > 0.05) for the comparison shown. Each panel shows data pooled from the 4 or more independent experiments we performed, each of which gave similar results (in A and B, n = 4–14 determinations per group). Data are presented as mean + SEM.
Figure 5
Figure 5. Mast cell chymase (MCPT4) contributes to mast cell–dependent degradation of VIP.
VIP (125 μM in 150 μl) was incubated ex vivo at 37°C for 30 minutes with medium (DMEM) alone (no mast cells) or with medium containing purified PMCs (8 × 10⁵) from WT C57BL/6 mice (WT PMCs), C57BL/6-Mcpt4–/– mice (Mcpt4–/– PMCs), or C57BL/6-Cpa3Y356L,E378A mice (Cpa3Y356L,E378A PMCs). The remaining amount of VIP was then measured by ELISA. *P < 0.015; ***P < 0.001; NS (P > 0.05) for the comparisons shown (Mann-Whitney U test). The panel shows data pooled from the 3 or more independent experiments we performed, each of which gave similar results (n = 3–6 determinations per group). Data are presented as mean + SEM.
Figure 6
Figure 6. Mast cell chymase can degrade either VIP or helodermin.
(A) VIP (125 μM in 150 μl) or (B) helodermin (125 μM in 150 μl) was incubated ex vivo at 37°C for 30 minutes with medium (DMEM) alone (no mast cells) or with medium containing purified PMCs (8 × 10⁵) from WT C57BL/6 mice (WT PMCs), C57BL/6-Mcpt4–/– mice (Mcpt4–/– PMCs), or C57BL/6-Cpa3Y356L,E378A mice (Cpa3Y356L,E378A PMCs); supernatants were then analyzed by mass spectrometry. Red arrows indicate cleavage sites found in (A) VIP or (B) helodermin after incubation with WT PMCs but not Mcpt4–/– PMCs. The long blue arrow indicates the single cleavage site in VIP that was found after incubation with either WT or Mcpt4–/– PMCs. White arrows indicate sites predicted to be susceptible to cleavage, and the dashed arrow indicates a previously reported cleavage site. The figure depicts results obtained in 2 independent experiments that gave similar results.
Figure 7
Figure 7. Evidence that MCPT5 does not contribute significantly to the mast cell’s ability to degrade and detoxify helodermin or VIP.
(A) VIP (125 μM in 150 μl) was incubated ex vivo at 37°C for 30 minutes with medium (DMEM) alone (no mast cells), or with medium containing purified PMCs (8 × 10⁵) from WT mice (WT PMCs) or Cpa3–/– mice, which lack both CPA3 and MCPT5 (Cpa3–/– PMCs). The remaining amount of VIP was then measured by ELISA. ***P < 0.001; NS (P > 0.05) for the comparisons shown (Mann-Whitney U test). The figure shows data pooled from the 4 independent experiments we performed, each of which gave similar results (n = 4 determinations per group). Data are presented as mean + SEM. (B) Changes in rectal temperatures after i.d. injection of helodermin (5 nmol in 20 μl DMEM solution) in the ear pinnae (1 ear pinna of each mouse) of WT and Cpa3–/– mice. NS (P > 0.05) for the comparisons shown. Rates of diarrhea in Kit+/+ and Cpa3–/– mice within 2 hours after helodermin injection were 17% (1/6) and 33% (2/6), respectively. P = 0.5. Data are presented as mean ± SEM. Each panel shows data pooled from 3 independent experiments with each group of mice, each of which gave similar results (n = 2 mice per group per experiment).
Figure 8
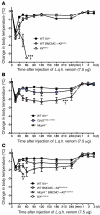
Figure 8. Mast cells and MCPT4 can limit the toxicity of deathstalker (yellow) scorpion (L.q.h.).
Changes in rectal temperature after i.d. injection of L. quinquestriatus hebraeus venom (7.5 μg in 50 μl of PBS) into a single ear pinna. (A) WT WBB6F1-Kit+/+, mast cell–deficient WBB6F1-KitW/W-v, and WT BMCMC→KitW/W-v mice. Death rates of Kit+/+, WT BMCMC→KitW/W-v, and KitW/W-v mice within 3 days after L. quinquestriatus hebraeus venom injection were 0% (0/10), 10% (1/10; P = 0.5 versus Kit+/+ mice), and 100% (10/10, P < 0.0001 versus Kit+/+ mice), respectively. (B) C57BL/6 WT, Cpa3Y356L,E378A, and Mcpt4–/– mice. Death rates of Kit+/+, Cpa3Y356L,E378A, and Mcpt4–/– mice within 3 days after L. quinquestriatus hebraeus venom injection were 0% (0/12), 0% (0/15; P = 1.0 versus Kit+/+ mice), and 44% (7/16; P = 0.01 versus Kit+/+ mice), respectively. (C) WT C57BL/6-Kit+/+, mast cell–deficient C57BL/6-KitW-sh/W-sh, WT BMCMC→KitW-sh/W-sh, and Mcpt4–/– BMCMC→KitW-sh/W-sh mice. Death rates of Kit+/+, WT BMCMC→KitW-sh/W-sh, Mcpt4–/– BMCMC→KitW-sh/W-sh, and KitW-sh/W-sh mice within 3 days after L. quinquestriatus hebraeus venom injection were 0% (0/11), 13% (2/15; P = 0.32 versus Kit+/+ mice), 57% (8/15, P = 0.004 versus Kit+/+ mice), and 100% (15/15, P < 0.0001 versus Kit+/+ mice), respectively. **P < 0.01; ***P < 0.001 versus WT WBB6F1-Kit+/+ or WT C57BL/6-Kit+/+ mice; P < 0.01 versus each of the other groups (A and B); #P < 0.01 versus WT BMCMC→KitW-sh/W-sh mice (C). Each panel shows data pooled from at least 3 independent experiments with each group of mice (n = 2–5 mice per group per experiment). Data are presented as mean ± SEM.
Figure 9
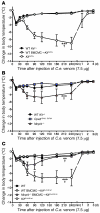
Figure 9. Mast cells and MCPT4 can limit the toxicity of Arizona bark scorpion (C.e.).
Changes in rectal temperature after i.d. injection of C. exilicauda venom (7.5 μg in 50 μl of PBS) into a single ear pinna. (A) WT WBB6F1-Kit+/+, mast cell–deficient WBB6F1-KitW/W-v, and WT BMCMC→KitW/W-v mice. Death rates of Kit+/+, WT BMCMC→KitW/W-v, and KitW/W-v mice within 3 days after C. exilicauda venom injection were 0% (0/11), 0% (0/10; P = 0.1 versus Kit+/+ mice), and 50% (5/10; P = 0.01 versus Kit+/+ mice), respectively. (B) C57BL/6 WT, Cpa3Y356L,E378A, and Mcpt4–/– mice. Death rates of Kit+/+, Cpa3Y356L,E378A, and Mcpt4–/– mice within 3 days after C. exilicauda venom injection were 0% (0/11), 0% (0/13; P = 1.0 versus Kit+/+ mice), and 42% (5/12, P = 0.01 versus Kit+/+ mice), respectively. (C) WT C57BL/6-Kit+/+, mast cell–deficient C57BL/6-KitW-sh/W-sh, WT BMCMC→KitW-sh/W-sh, and Mcpt4–/– BMCMC→KitW-sh/W-sh mice. Death rates of Kit+/+, WT BMCMC→KitW-sh/W-sh, Mcpt4–/– BMCMC→KitW-sh/W-sh, and KitW-sh/W-sh mice within 3 days after C. exilicauda venom injection were 0% (0/12), 0% (0/12; P = 1.0 versus Kit+/+ mice), 50% (6/12, P = 0.007 versus Kit+/+ mice), and 58% (7/12, P = 0.002 versus Kit+/+ mice), respectively. **P < 0.01; ***P < 0.001 versus WT WBB6F1-Kit+/+ or WT C57BL/6-Kit+/+ mice; P < 0.01 to 0.001 versus each of the other groups (AC). Each panel shows data pooled from at least 3 independent experiments with each group of mice (n = 2–5 mice per group per experiment). Data are presented as mean ± SEM.

Similar articles

Cited by

References

    1. Mekori YA, Metcalfe DD. Mast cells in innate immunity. Immunol Rev. 2000;173:131–140. doi: 10.1034/j.1600-065X.2000.917305.x. - DOI - PubMed
    1. Dawicki W, Marshall JS. New and emerging roles for mast cells in host defence. Curr Opin Immunol. 2007;19(1):31–38. doi: 10.1016/j.coi.2006.11.006. - DOI - PubMed
    1. Abraham SN, St John AL. Mast cell-orchestrated immunity to pathogens. Nat Rev Immunol. 2010;10(6):440–452. - PMC - PubMed
    1. Maurer M, et al. Mast cells promote homeostasis by limiting endothelin-1-induced toxicity. Nature. 2004;432(7016):512–516. doi: 10.1038/nature03085. - DOI - PubMed
    1. Piliponsky AM, et al. Neurotensin increases mortality and mast cells reduce neurotensin levels in a mouse model of sepsis. Nat Med. 2008;14(4):392–398. - PMC - PubMed

Publication types

MeSH terms