. 2011 Sep 16;30(21):4465-78.
doi: 10.1038/emboj.2011.318.

BAX inhibitor-1 regulates autophagy by controlling the IRE1α branch of the unfolded protein response

Affiliations

BAX inhibitor-1 regulates autophagy by controlling the IRE1α branch of the unfolded protein response

Karen Castillo et al. EMBO J. .

Erratum in

Abstract

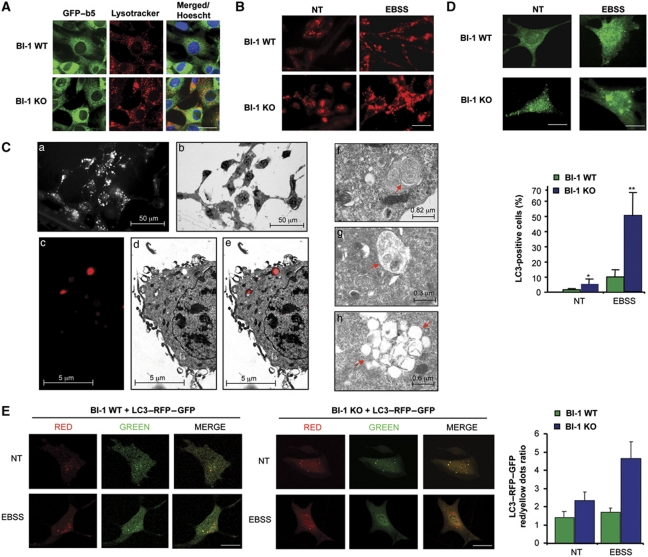
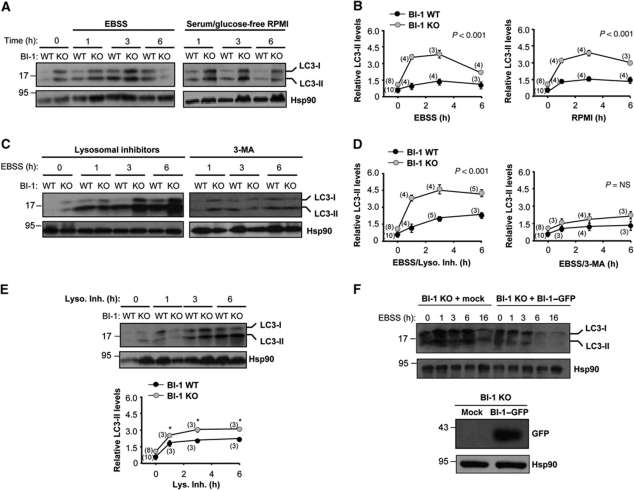
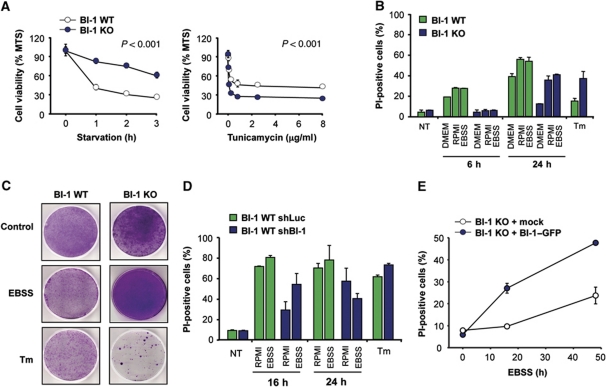
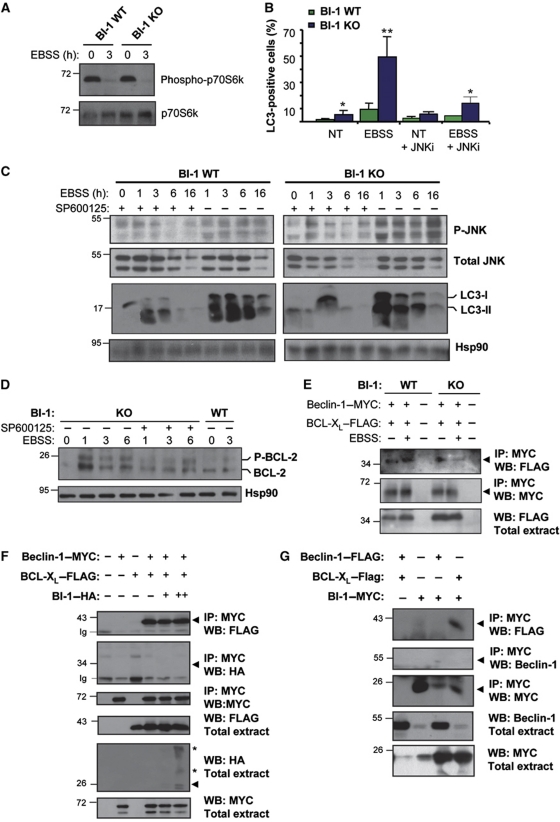
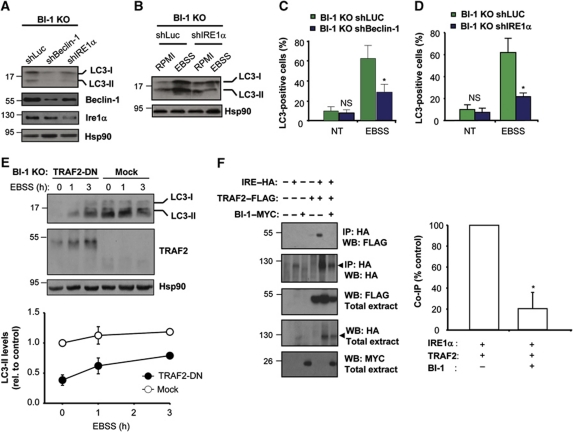
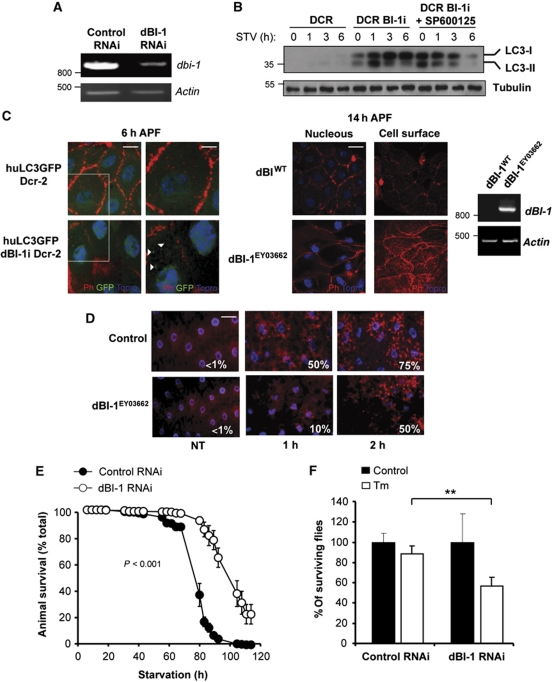
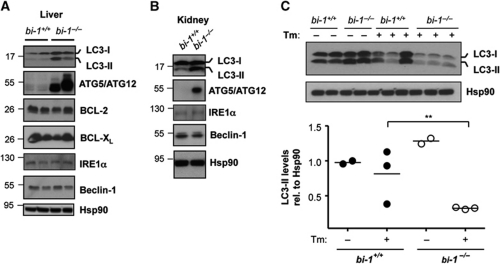
Both autophagy and apoptosis are tightly regulated processes playing a central role in tissue homeostasis. Bax inhibitor 1 (BI-1) is a highly conserved protein with a dual role in apoptosis and endoplasmic reticulum (ER) stress signalling through the regulation of the ER stress sensor inositol requiring kinase 1 α (IRE1α). Here, we describe a novel function of BI-1 in the modulation of autophagy. BI-1-deficient cells presented a faster and stronger induction of autophagy, increasing LC3 flux and autophagosome formation. These effects were associated with enhanced cell survival under nutrient deprivation. Repression of autophagy by BI-1 was dependent on cJun-N terminal kinase (JNK) and IRE1α expression, possibly due to a displacement of TNF-receptor associated factor-2 (TRAF2) from IRE1α. Targeting BI-1 expression in flies altered autophagy fluxes and salivary gland degradation. BI-1 deficiency increased flies survival under fasting conditions. Increased expression of autophagy indicators was observed in the liver and kidney of bi-1-deficient mice. In summary, we identify a novel function of BI-1 in multicellular organisms, and suggest a critical role of BI-1 as a stress integrator that modulates autophagy levels and other interconnected homeostatic processes.


Conflict of interest statement

The authors declare that they have no conflict of interest.

Figures

Figure 1
Figure 1
Increased accumulation of autophagosomes and lysosomes in BI-1-deficient cells. (A) BI-1 WT and KO MEFs cells were stably transduced with retroviruses expressing cytochrome b5–GFP to visualize the ER (green). Then cells were stained with lysotracker (red) and observed with a confocal microscope. Nucleus was stained with Hoechst (blue). Scale bar: 30 μm. (B) BI-1 WT and KO MEFs cells stimulated with EBSS for 3 h to induce autophagy. Acidic vesicles were visualized with a confocal microscope after lysotracker staining. Data represent the results of three independent experiments. Scale bar: 50 μm. (C) (a) Epifluorescence imaging of BI-1 KO cells stained with lysotracker; (b) electron micrograph of the same field of cells shown in (a); (c–e), magnification of lysotracker-positive vesicles in BI-1 KO cells exposed to EBSS for 3 h and visualized with a fluorescent microscope (c) and the same field subsequently imaged by EM (d). Overlapping images are presented (e). Left panel: analysis of vesicular structures by EM with morphologies resembling early (f), intermediate (g) and late (h) autophagy vesicles. (D) Left panel: the distribution of endogenous LC3 was monitored by immunofluorescence and confocal microscopy in BI-1 WT and KO MEFs cells at basal conditions (NT) or after exposure to EBSS for 3 h. Scale bar: left 15 μm and right 10 μm. Right panel: quantification of the number cells containing three or more LC3-positive vesicles (N=160 cells). Mean and standard deviation are presented (N=4). Student's t-test was used to analyse statistical significance, **P<0.001 and *P<0.01. (E) BI-1 WT and KO cells were transiently transfected with an expression vector for a monomeric-tandem LC3–RFP–GFP construct. After 24 h, cells were exposed to EBSS for 3 h. Autophagy fluxes were monitored in living cells by visualizing the distribution of LC3-positive dots in the red and green channels using a confocal microscope. Scale bar: 10 μm. Right panel: quantification of the ratio between red and yellow dots per cell is presented. Mean and standard error of the analysis of 15 cells are shown.
Figure 2
Figure 2
BI-1 deficiency enhances autophagy flux. (A) BI-1 WT and KO MEFs were treated with EBSS (left panel) or glucose/serum-free RPMI media (right panel) for the indicated time points. Then, levels of LC3 were determined by western blot analysis. LC3-I and LC3-II forms are indicated. Hsp90 levels were assessed as loading control. (B) Quantification of LC3-II levels relative to Hsp90 expression was performed in several experiments performed as presented in (A). (C) Cells were pre-treated with a cocktail of lysosomal inhibitors (200 nM bafilomycin A1, 10 μg/ml pepstatin, and E64d; left panel) or 10 mM 3-methyladenine (3-MA; right panel) for 12 h and then exposed to starvation. LC3 levels monitored by western blot (D) and quantification of LC3-II levels relative to Hsp90 were performed in the experimental conditions described in (C). (E) Basal autophagy flux was monitored in cells treated with a cocktail of lysosomal inhibitors (Lys. Inh.) in the presence of normal cell culture media. Right panel: quantification of independent experiments is presented. (F) BI-1 KO cells were stably transduced with retroviruses expressing BI-1–GFP or empty vector, and then levels of LC3-II were assessed over time by western blot analysis after exposure to EBSS. Right panel: as control, the levels of BI-1–GFP were monitored by western blot. Hsp90 levels were used as loading control. In (B, D and E) mean and standard deviation are presented. Two-way ANOVA was applied to analyse statistical significance. In parenthesis, the number of independent experiments for each time point is indicated. Student's t-test was also used in (E) to analyse the statistical significance between each time point (*P<0.001). In (B, D and E), normalization was performed as a ratio with the LC3-II/Hsp90 normalized levels from non-treated BI-1 WT cells.
Figure 3
Figure 3
BI-1 deficiency increases cell survival under nutrient starvation conditions. (A) Left panel: BI-1 WT and KO MEFs cells were incubated in EBSS, and then cell viability was monitored using the MTS assay. Right panel: a similar experiment was performed after treating cells with the indicated concentration of tunicamycin for 24 h. Mean and standard deviation are presented of triplicates representative of three independent experiments. (B) BI-1 WT and KO cells were treated with three different starvation stimuli for 6 and 24 h. Cell death was determined after propidium iodide (PI) staining and FACS analysis. In addition, cells were treated with 100 ng/ml tunicamycin (Tm) for 24 h. Mean and standard deviation are presented of one experiment performed in triplicates. (C) Cells were exposed to EBSS for 6 h or 1 μg/ml Tm for 2 h, and then replated in normal cell culture media. After 5 days, cell viability was monitored by staining with crystal violet. Data are representative of three independent experiments. (D) BI-1 WT MEFs were stably transduced with lentiviral expression vectors to deliver an shRNA against bi-1 mRNA or control mRNA (luciferase shRNA). Cell survival was measured after treatment of cells as described in (B). Mean and standard deviation of an experiment made by triplicate, representative of two independent experiments. (E) BI-1 KO cells were stably transduced with retroviruses expressing BI-1–GFP or empty vector, and then exposed to EBSS for indicated time points. Cell viability was monitored after PI staining by FACS. Mean and standard deviation are presented of triplicates representative of two independent experiments.
Figure 4
Figure 4
BI-1 regulates Beclin-1-dependent autophagy by controlling JNK activation. (A) BI-1 WT and KO MEFs were treated with EBSS for 2 h, and the levels of phospho-p70S6k were determined by western blot analysis. Total p70S6k is also shown. (B) LC3 was monitored by immunofluorescence in cells treated with EBSS for 3 h in the presence or absence of 10 μM JNK inhibitor SP600125. Mean and standard deviation are presented (N=3). Student's t-test was used to analyse statistical significance, *P<0.001 and **P<0.0001. (C) BI-1 WT and KO cells were treated with EBSS for indicated time points, in the presence or absence of 10 μM of the JNK inhibitor SP600125. Levels of phosphorylation of JNK (pJNK) and LC3-II were determined by western blot. The levels of total JNK and Hsp90 are shown as control (N=4). Image was assembled from cropped lanes of the same western blot analysis of the same gel. (D) BI-1 WT and KO cells were treated with EBSS for indicated time points in the presence or absence of 10 μM SP600125, and the electrophoretic shift associated with BCL-2 phosphorylation was monitored by western blot. (E) BI-1 WT and KO cells were co-transfected with expression vectors for Beclin-1–MYC, BI-1—HA, and BCL-XL–FLAG. After 24 h, cells were treated with EBSS for 2 h or left untreated. The association of MYC-tagged expressed Beclin-1 and BCL-XL–FLAG was assessed by immunoprecipitation of Beclin-1 followed by western blot analysis. (F) 293T cells were co-transfected with expression vectors for Beclin-1–MYC, BI-1–HA, and BCL-XL–FLAG. Cell extracts were prepared in CHAPS buffer and Beclin-1–MYC immunoprecipitated, and the possible co-precipitation of BI-1–HA, and BCL-XL–FLAG was assessed by western blot analysis (N=3). Asterisks indicate BI-1 oligomers. (G) 293T cells were co-transfected as described in (F) and BI-1–HA was immunoprecipitated, and the possible co-precipitation of Beclin-1–MYC, and BCL-XL–FLAG determined by western blot analysis (N=3). Figure source data can be found with the Supplementary Information.
Figure 5
Figure 5
The regulation of nutrient starvation-induced autophagy by BI-1 depends on IRE1α and TRAF2. (A) BI-1 KO MEFs were stably transduced with lentiviral vectors expressing an shRNA against beclin-1 (shBeclin-1) or ire1α (shIRE1α) mRNA or luciferase (shLuc) as control. The levels of LC3, Beclin-1, IRE1α and Hsp90 were monitored by western blot. (B) BI-1 KO MEFs were stably transduced with lentiviral vectors as described in A. Cells were exposed to EBSS for 3 h, and then LC3 levels were analysed by western blot. Image was assembled from cropped lanes of the same western blot analysis. (C) Endogenous LC3 distribution was visualized using immunofluorescence and confocal microscopy in BI-1 KO/shLuc and BI-1 KO/shBeclin-1 cells. Quantification represents the visualization of at least 180 cells. Student's t-test was used to analyse statistical significance. Mean and standard deviation are presented, *P<0.001, NS: non-significant. (D) LC3 was visualized and quantified in BI-1 KO/shLuc and BI-1 KO/shIRE1α cells described in (B) by immunofluorescence and confocal microscopy analysis. (E) BI-1 KO cells were transiently transfected with a TRAF2 dominant-negative (TRAF2-DN) construct or empty vector (mock), and after 48 h cells were stimulated with EBSS and the levels of LC3-II and Hsp90 were monitored by western blot. Right panel: quantification of relative LC3-II levels normalized with Hsp90 and non-treated cells. Mean and standard deviation are presented. (F) 293T cells were co-transfected with expression vectors for HA-tagged IRE1α (IRE1–HA), TRAF2–FLAG, and MYC-tagged BI-1 (BI1–MYC). After 48 h of transfection, HA-tagged proteins were immunoprecipitated and the possible interaction with TRAF2 was analysed by western blot. Right panel: the percentage of TRAF2 dissociation from IRE1α by the presence or absence of BI-1 was quantified and normalized with the expression levels observed in the inputs. For comparison, the co-IP signal observed in the absence of BI-1 was normalized as 100% co-IP in each independent experiment (N=3). Mean and standard deviation are presented, *P<0.05. Figure source data can be found with the Supplementary Information.
Figure 6
Figure 6
BI-1 controls autophagy activation in vivo in Drosophila melanogaster. (A) The expression of dBI-1 was knocked down in Drosophila melanogaster. Then, relative expression levels of dBI-1 mRNA were monitored by semiquantitative PCR. Actin levels were monitored as control. (B) LC3 levels were monitored in control (Da-Gal4>huLC3:GFP) or dBI-1 RNAi larvae (Da-Gal4>huLC3:GFP, Dcr2, dBI-1i) under basal or fasting conditions. Then, huLC3–GFP levels were analysed by western blot. In addition, dBI-1i larvae were treated with 100 μM SP600125 (added in the growing media). (C) Left panel: the presence of LC3-positive vesicles (white arrowheads) was monitored by confocal microscopy in control (Da-Gal4>huLC3>GFP) and dBI-1 knockdown pupae (Da-Gal4>huLC3:GFP, Dcr2, dBI-1i) after 6 h of puparium formation. The organization of actin cytoskeleton was monitored by staining with phalloidin (Ph, red). Nucleus was stained with Topro (blue). Scale bar: left 20 μm and right 11 μm. Right panel: overexpression of dBI-1 (dBI-1EY03662) delays salivary gland degradation. Overexpression of dBI-1 was confirmed by semiquantitative RT–PCR. Actin levels were monitored as loading control. Right panel: wild-type control and dBI-1EY03662 pupae were analysed at 14 h after puparium formation. Superficial and internal confocal planes of the cells are presented. Scale bar: 40 μm. (D) Wild-type control and dBI-1EY03662 larvae were cultured in fasting conditions for different periods of time and fat body stained with lysotracker (red) and Hoechst (blue). Then, lysosomal content in the fat body was visualized by epifluorescence microscopy. The percentage of cells presenting lysotracker-positive stain is indicated. Scale bar: 50 μm. (E) Control or dBI-1 knockdown adult flies were exposed to nutrient starvation and then animal viability was monitored over time for several days. In all, 100 individuals were monitored in each condition. Data represent mean and standard error (N=3). Two-way ANOVA was used to analyse statistical significance between groups. (F) Second instar dBI-1 RNAi or control larvae were grown in food supplemented with 25 μg/ml Tm dissolved in DMSO or 0.5% DMSO as control. The number of individual reaching the adult fly stage was evaluated. Mean and standard error are presented (N=3), **P<0.01.
Figure 7
Figure 7
Enhanced LC3-II levels in the liver and kidney of bi-1-deficient mice. (A) The levels of LC3, Atg5/Atg12 complex, Beclin-1, Bcl-2, Bcl-XL, IRE1α and Hsp90 were monitored in liver protein extracts of bi-1+/+ and bi-1−/− at 6-month-old mice. Each well represents independent mice. (B) A similar analysis was performed for indicated markers in kidney protein extracts as described in liver. (C) bi-1+/+ and bi-1−/− mice were injected with 50 ng/ml of tunicamycin by intraperitoneal injection (N=3) and then LC3 levels were monitored in liver protein extracts by western blot analysis. Right panel: quantification of relative LC3-II levels, **P<0.005.

References

    1. Ahn T, Yun CH, Kim HR, Chae HJ (2010) Cardiolipin, phosphatidylserine, and BH4 domain of Bcl-2 family regulate Ca2+/H+ antiporter activity of human Bax inhibitor-1. Cell Calcium 47: 387–396 - PubMed
    1. Arsham AM, Neufeld TP (2009) A genetic screen in Drosophila reveals novel cytoprotective functions of the autophagy-lysosome pathway. PLoS One 4: e6068. - PMC - PubMed
    1. Bailly-Maitre B, Belgardt BF, Jordan SD, Coornaert B, von Freyend MJ, Kleinridders A, Mauer J, Cuddy M, Kress CL, Willmes D, Essig M, Hampel B, Protzer U, Reed JC, Bruning JC (2010) Hepatic Bax inhibitor-1 inhibits IRE1alpha and protects from obesity-associated insulin resistance and glucose intolerance. J Biol Chem 285: 6198–6207 - PMC - PubMed
    1. Bailly-Maitre B, Fondevila C, Kaldas F, Droin N, Luciano F, Ricci JE, Croxton R, Krajewska M, Zapata JM, Kupiec-Weglinski JW, Farmer D, Reed JC (2006) Cytoprotective gene bi-1 is required for intrinsic protection from endoplasmic reticulum stress and ischemia-reperfusion injury. Proc Natl Acad Sci USA 103: 2809–2814 - PMC - PubMed
    1. Barrientos SA, Martinez NW, Yoo S, Jara JS, Zamorano S, Hetz C, Twiss JL, Alvarez J, Court FA (2011) Axonal degeneration is mediated by the mitochondrial permeability transition pore. J Neurosci 31: 966–978 - PMC - PubMed

Publication types

MeSH terms