. 2011 Sep 18;17(10):1290-7.
doi: 10.1038/nm.2446.

A human memory T cell subset with stem cell-like properties

Affiliations

A human memory T cell subset with stem cell-like properties

Luca Gattinoni et al. Nat Med. .

Abstract

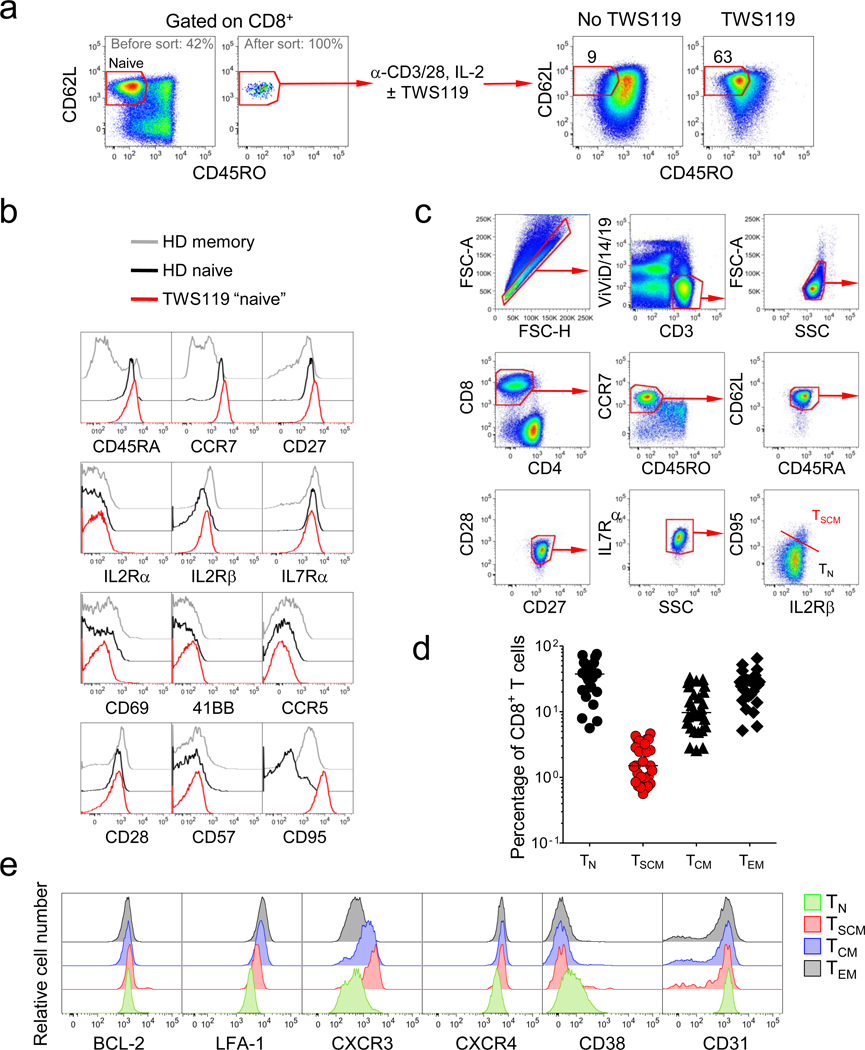
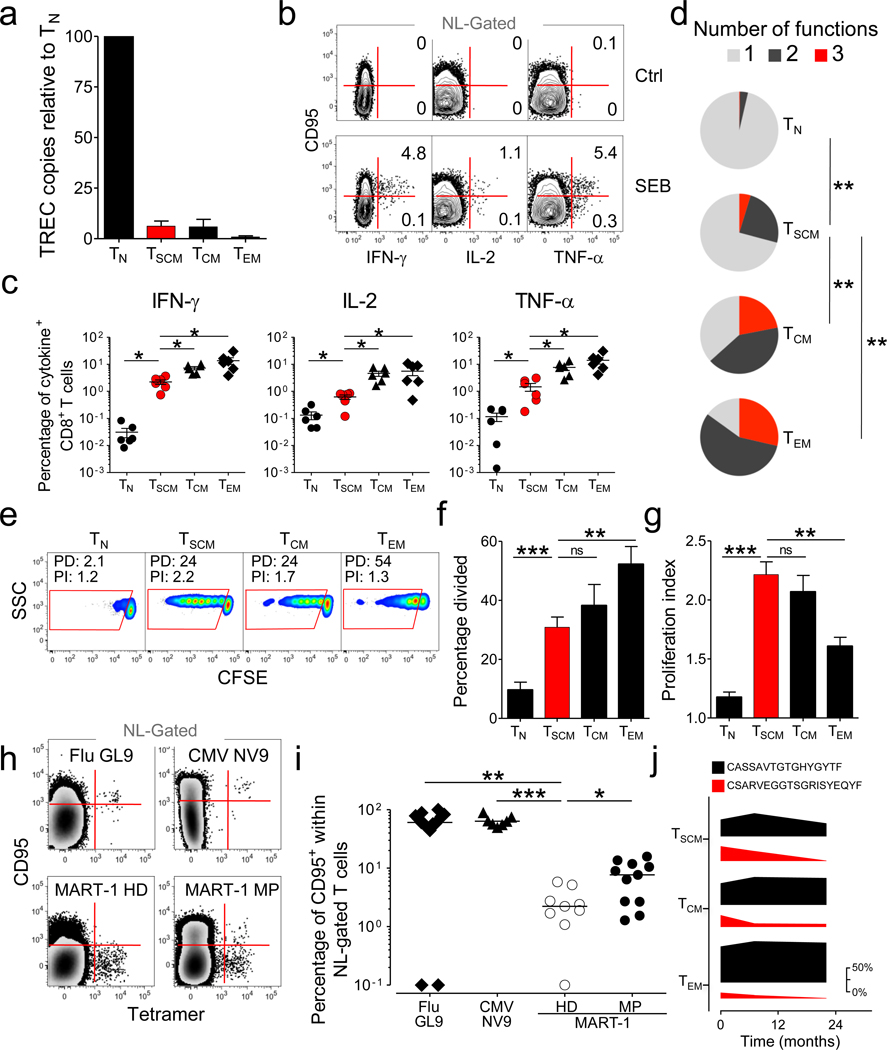
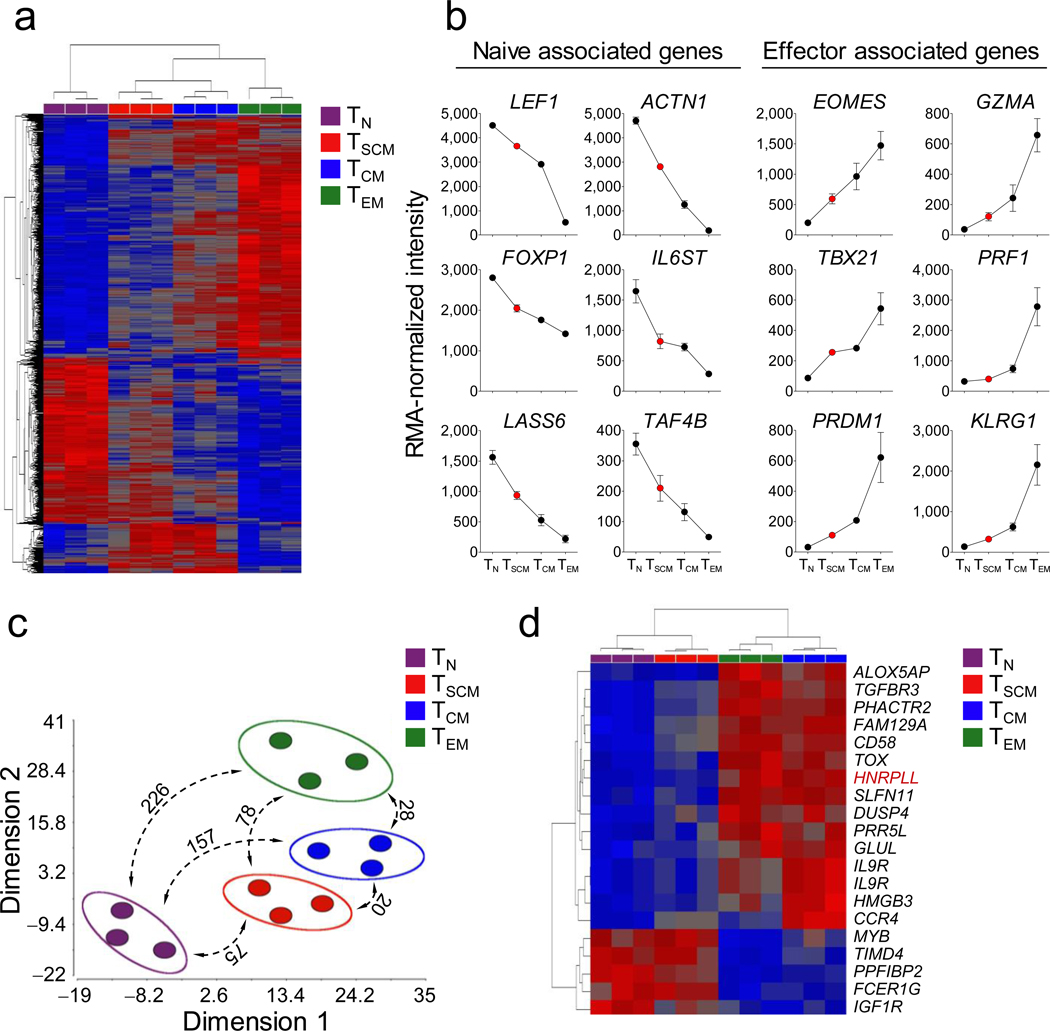
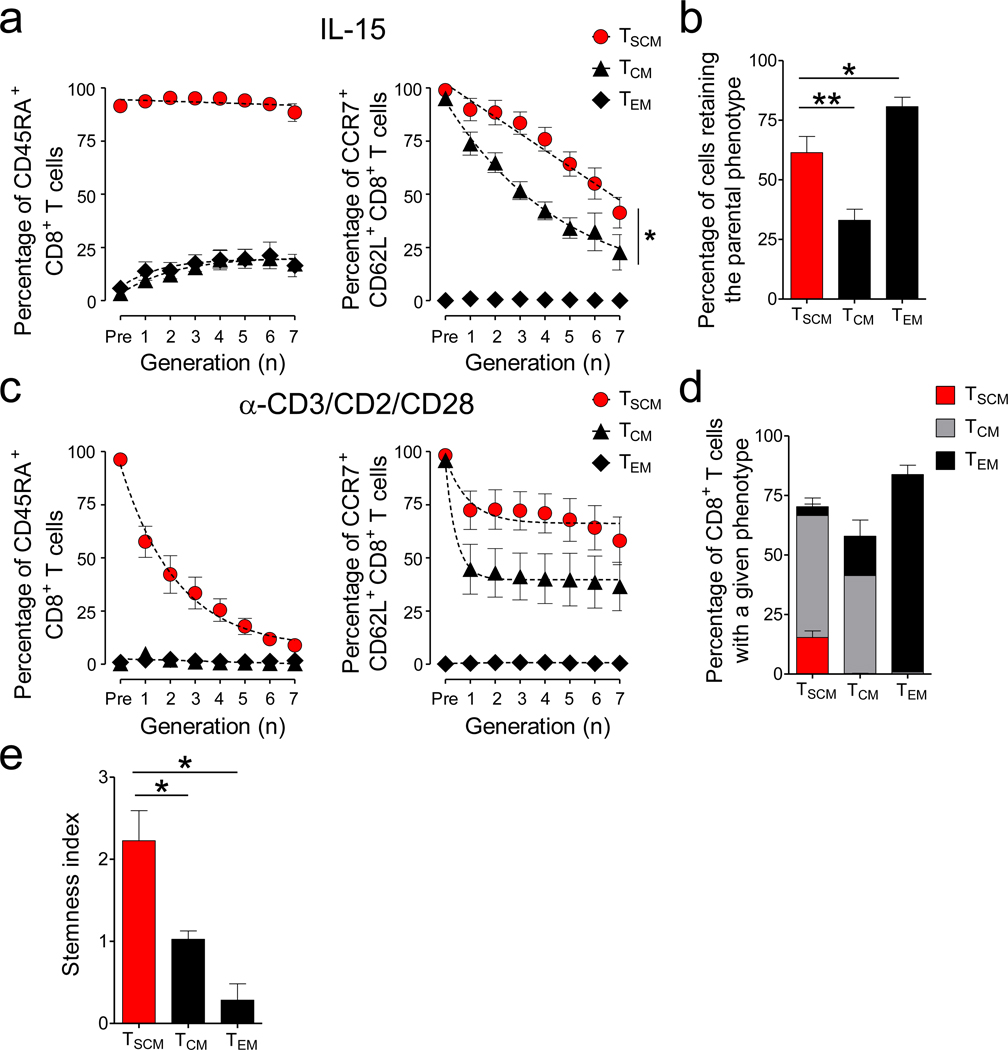
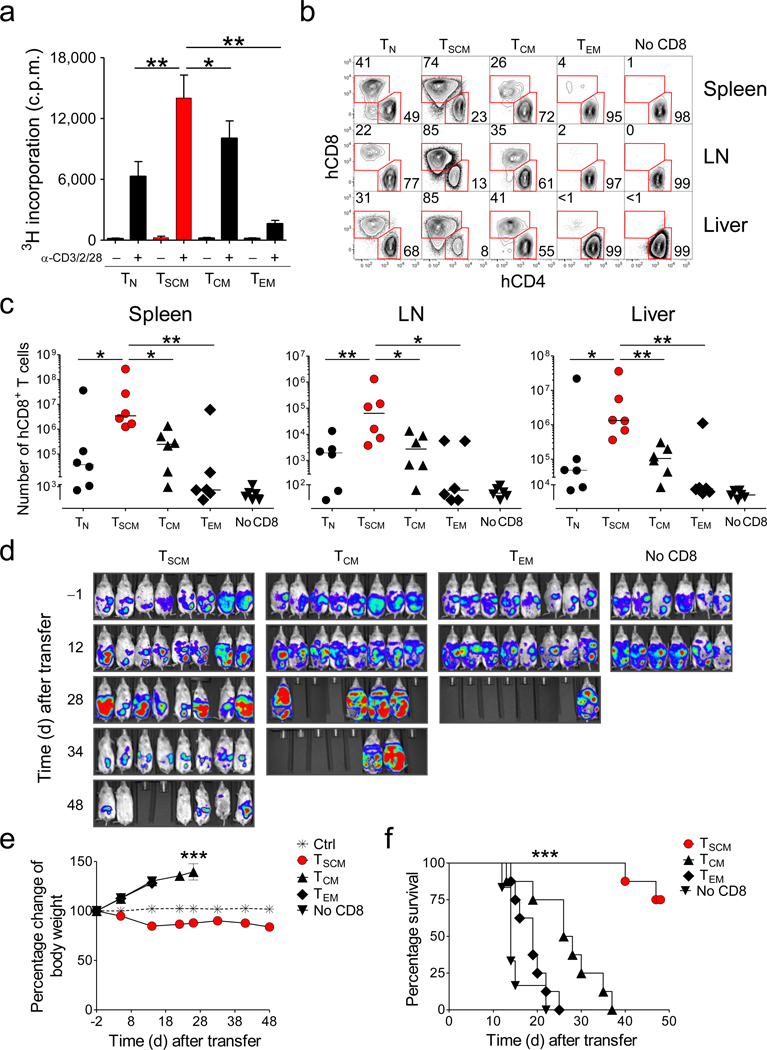
Immunological memory is thought to depend on a stem cell-like, self-renewing population of lymphocytes capable of differentiating into effector cells in response to antigen re-exposure. Here we describe a long-lived human memory T cell population that has an enhanced capacity for self-renewal and a multipotent ability to derive central memory, effector memory and effector T cells. These cells, specific to multiple viral and self-tumor antigens, were found within a CD45RO(-), CCR7(+), CD45RA(+), CD62L(+), CD27(+), CD28(+) and IL-7Rα(+) T cell compartment characteristic of naive T cells. However, they expressed large amounts of CD95, IL-2Rβ, CXCR3, and LFA-1, and showed numerous functional attributes distinctive of memory cells. Compared with known memory populations, these lymphocytes had increased proliferative capacity and more efficiently reconstituted immunodeficient hosts, and they mediated superior antitumor responses in a humanized mouse model. The identification of a human stem cell-like memory T cell population is of direct relevance to the design of vaccines and T cell therapies.


Figures

Figure 1
Figure 1. Identification of TSCM cells in human blood
a, Flow cytometry analysis of sorted human CD45ROCD62L+ naïve CD8+ T cells prior to and 14 days after stimulation with α-CD3/CD2/CD28-coated beads and IL-2 in the presence or absence of 5µM TWS119. Numbers indicate the percentage of cells in the CD45ROCD62L+ gate. b, Flow cytometry analysis of TWS119-generated CD45ROCD62L+ naïve-like CD8+ T cells overlaid with CD45ROCD62L+ naïve and memory (non-CD45RO CD62L+) cells from a healthy donor (HD). c, Flow cytometry analysis of PBMC from a healthy donor. Dot plots show the gating strategy to identify CD95+, IL2Rβ+ TSCM cells. d, Percentages of circulating CD8+ T-cell subsets in 29 healthy donors. e, Flow cytometry analysis of PBMC from a representative healthy donor. Overlaid histogram plots show expression levels of a given molecule in different CD8+ T-cell subsets. CD8+ T-cell subsets were defined as follows: TN cells, CD3+CD8+CD45ROCCR7+CD45RA+CD62L+CD27+CD28+IL7Rα+CD95; TSCM cells, CD3+CD8+CD45ROCCR7+CD45RA+CD62L+CD27+CD28+IL7Rα+CD95+; TCM cells, CD3+CD8+CD45RO+CD45RA CCR7+CD62L+; TEM cells, CD3+CD8+CD45RO+CD45RACCR7CD62L.
Figure 2
Figure 2. TSCM cells possess attributes of conventional memory T cells
a, TCR excision circle (TREC) copy number in sorted CD8+ T-cell subsets relative to TN cells. Data are represented as mean ± s.e.m. of 4 donors. b, Intracellular cytokine staining of PBMC from a representative healthy donor after stimulation with SEB. Graphs show naïve-like (NL) gated T cells. NL, CD45ROCCR7+CD45RA+CD27+CD28+. Numbers represent the percentage of CD95+ (TSCM) and CD95 (TN) cells producing a single cytokine. c, Percentages of CD8+ T-cell subsets producing IFN-γ, IL-2 and TNF-α in 6 healthy donors (obtained as described in panel b). d, Pie charts depicting the quality of the cytokine response in CD8+ T-cell subsets in 6 healthy donors as determined by the Boolean combination of gates identifying IFN-β+, IL-2+ and TNF-α+ cells. e, CFSE dilution in sorted CD8+ T-cell subsets after stimulation with 25 ng ml−1 of IL-15 for 10 days. Data are shown after gating on CD8+ cells. PD: percentage divided; PI: proliferation index. f, Percentage divided cells and g, Proliferation index of different CD8+ T-cell subsets after stimulation as in panel e. Data are represented as means ± s.e.m of 9 donors. h, Flow cytometry analysis of PBMC from HLA-A2+ donors. Graphs show tetramer-binding cells vs. CD95 expression in the NL (CD45ROCCR7+CD45RA+CD27+IL7Rα+) gate. i, Percentage of tetramer-binding cells expressing CD95 in the NL gate determined as in panel h. Data represent the donors tested for tetramer specificity. HD: healthy donor; MP: melanoma patient. j, Frequency of two immunodominant CMV-specific TCRβ clonotypes relative to all CMV-specific TCRβ clonotypes in pp65 -specific T-cell subsets isolated over a period of 22 months from a representative donor. The figure legend shows the CDR3β amino acid sequences. Changes in the frequencies of immunodominat clonotypes are depicted as the thickness of the bars, with the magnitude scale shown on the right. * = P < 0.05; ** = P < 0.01; *** = P < 0.001; ns= not significant (t test, c,f,g,I and χ2 permutation test, d).
Figure 3
Figure 3. TSCM cells represent a distinct, less differentiated T-cell memory subset
a, Heat map of differentially expressed genes (P < 0.01 One-Way Repeated Measures ANOVA, FDR < 5% Benjamini-Hochberg's method) among CD8+ T-cell subsets. Red and blue colors indicate increased and decreased expression respectively. b, Robust Multichip Analysis (RMA)-normalized intensity of selected display of genes progressively downregulated (naïve associated genes) or upregulated (effector associated genes) from TN cells →TSCM cells →TCM cells →TEM cells. Data are represented as means ± s.e.m of 3 donors. c) Multidimensional scaling (MDS) analysis of differentially expressed genes (P < 0.01, FDR < 5%). Numbers represent the differentially regulated genes among each CD8+ T-cell subset (P < 0.01 (t test) and > 2 fold change in expression level). d, Heat map of differentially-expressed genes among TSCM and TCM cells (P < 0.01 (t test) and > 2 fold change in expression level). Red and blue colors indicate increased and decreased expression, respectively. Full gene names are listed in the Supplementary Information.
Figure 4
Figure 4. Enhanced self-renewal and multipotency of TSCM cells
a, Percentage of CD8+ T cells expressing CCR7 and CD62L (right panel) and CD45RA (left panel) relative to cell division after exposure to 25ng ml−1 of IL-15 for 10 days. Slopes (S) were compared using a Wilcoxon rank test, *= P = 0.0391. s=in(gig¯)(pip¯)in(gig¯)2 where g = generation number and p = percentage of CD62L+CCR7+ cells (n = 8). b, Percentage of CFSE-diluted CD8+ T cells that retained the parental phenotype following stimulation with 25ng ml−1 of IL-15 for 10 days. c, Percentage of CD8+ T cells expressing CCR7 and CD62L (right panel) and CD45RA (left panel) relative to cell division after stimulation with α-CD3/CD2/CD28-coated beads for 6 days. d, Percentage of CFSE-diluted CD8+ T cells with a given phenotype following stimulation with α-CD3/CD2/CD28-coated beads for 6 days. e, Stemness index of CD8+ memory T-cell subsets. Stemness index was calculated by multiplying self-renewal (SI) and multipotency (MI) indexes. SI was calculated as follows: SI= 2PIPRP, PI=Proliferation index, PRP= Percentage of cells retaining the input phenotype and MI was calculated as the net entropy of the progeny T-cell subsets MI=inpilnpi where p = percentage of a given T-cell subset generated following α-CD3/CD2/CD28 stimulation. Data are represented as mean ± s.e.m of 4 donors; * = P < 0.05 (t test) (n = 4).
Figure 5
Figure 5. Increased proliferative capacity, survival and antitumor activity of TSCM cells
a, 3H-thymidine incorporation by sorted CD8+ T-cell subsets after stimulation with α-CD3/CD2/CD28-coated beads. Data are represented as means ± s.e.m of 10 donors. Results are normalized to the number of seeded cells, as different cell numbers were obtained from different sorts. * = P < 0.05; ** = P < 0.01; *** = P < 0.001 (t test) b, Flow cytometry analysis of human T cells in the spleen, lymph nodes (LN) and liver of a representative NSG mouse at 4 weeks following adoptive transfer of CD4+ T cells (5 × 10⁶) with or without sorted CD8+ T-cell subsets (106). Graphs show T cells after gating on human CD45+ cells. Numbers indicate the percentage of cells in the CD4+CD8 or CD4CD8+ gates. c, Total human CD8+ T-cell recovery in the spleens, LN and livers from 6 NSG mice 4 weeks following adoptive transfer of CD4+ T cells with or without sorted CD8+ T-cell subsets. A total of 6 mice per T-cell subset from two independent experiments (3 replicate mice per T-cell subset per experiment) are shown. Horizontal bars indicate median values. * = P < 0.05; ** = P < 0.01 (t test) d–f, In vivo bioluminescent imaging (d), percentage change of body weight (e), and survival of NSG mice (f) bearing M108-luciferase mesothelioma after adoptive transfer of CD4+ T cells (106) with or without sorted CD8+ T-cell subsets (3 × 10⁶) expressing a mesothelin-specific chimeric antigen receptor. *** = P < 0.001 One-Way Repeated Measures ANOVA (e) and Log-rank (Mantel-Cox) Test (f).

Comment in

  • Memory in disguise.
    Sallusto F, Lanzavecchia A. Sallusto F, et al. Nat Med. 2011 Oct 11;17(10):1182-3. doi: 10.1038/nm.2502. Nat Med. 2011. PMID: 21988989 No abstract available.
  • T cell memory: the stem of T cell memory.
    Papatriantafyllou M. Papatriantafyllou M. Nat Rev Immunol. 2011 Oct 25;11(11):716. doi: 10.1038/nri3098. Nat Rev Immunol. 2011. PMID: 22025045 No abstract available.

References

    1. Wakim LM, Bevan MJ. From the thymus to longevity in the periphery. Curr. Opin. Immunol. 2010;22:274–278. - PMC - PubMed
    1. Kim PS, Ahmed R. Features of responding T cells in cancer and chronic infection. Curr. Opin. Immunol. 2010;22:223–230. - PMC - PubMed
    1. Klebanoff CA, Gattinoni L, Restifo NP. CD8+ T-cell memory in tumor immunology and immunotherapy. Immunol. Rev. 2006;211:214–224. - PMC - PubMed
    1. Fearon DT, Manders P, Wagner SD. Arrested differentiation, the self-renewing memory lymphocyte, and vaccination. Science. 2001;293:248–250. - PubMed
    1. Stemberger C, et al. Stem cell-like plasticity of naive and distinct memory CD8+ T cell subsets. Semin. Immunol. 2009;21:62–68. - PubMed

Publication types

MeSH terms

Associated data