. 2011 Sep 18;14(10):1309-16.
doi: 10.1038/nn.2927.

Cone photoreceptor contributions to noise and correlations in the retinal output

Affiliations

Cone photoreceptor contributions to noise and correlations in the retinal output

Petri Ala-Laurila et al. Nat Neurosci. .

Abstract

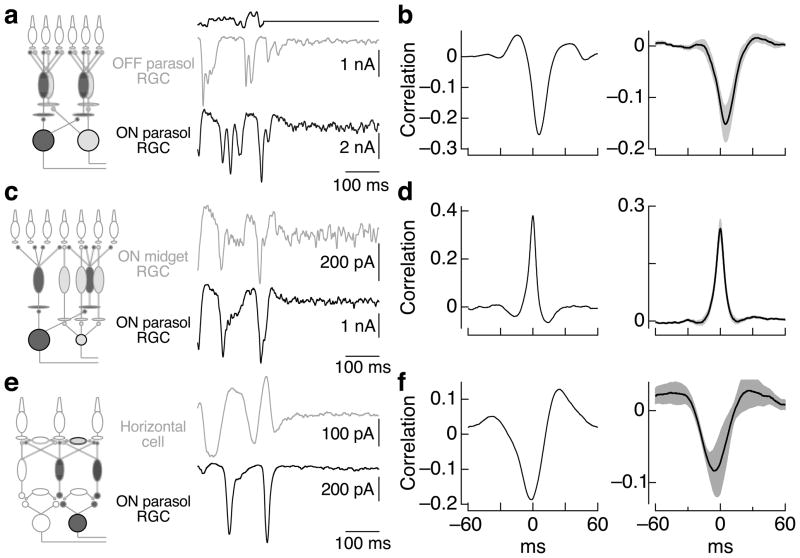
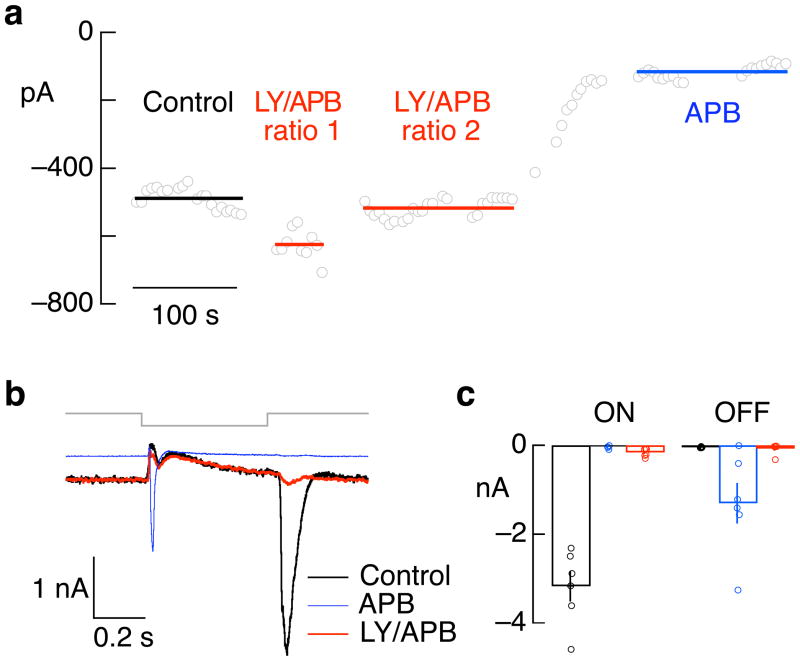
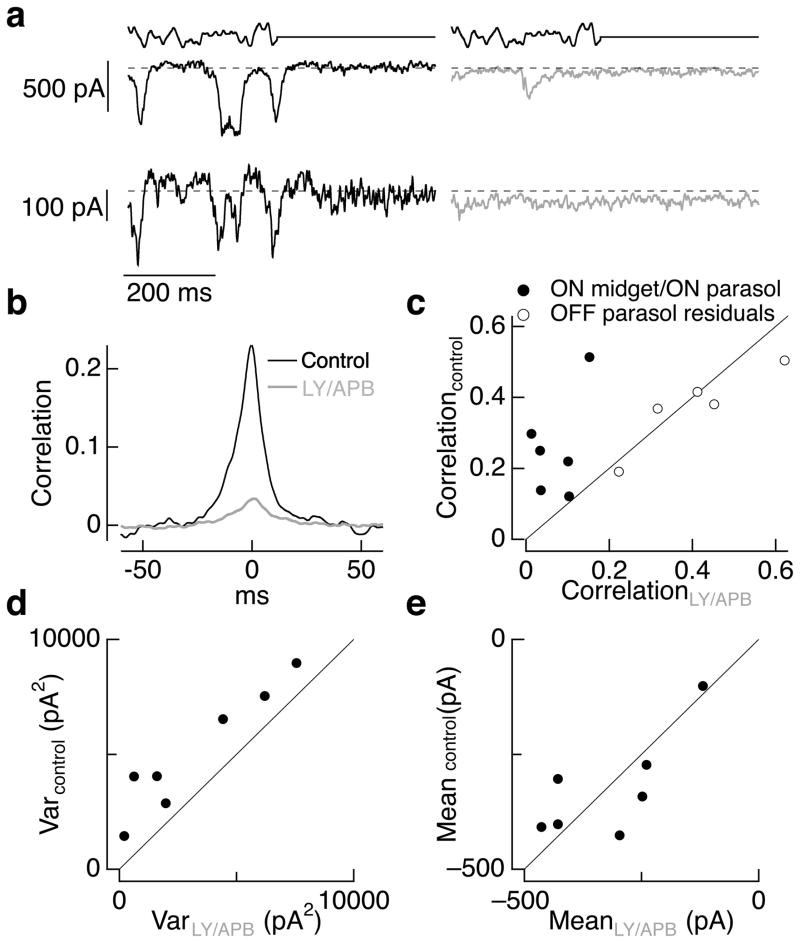
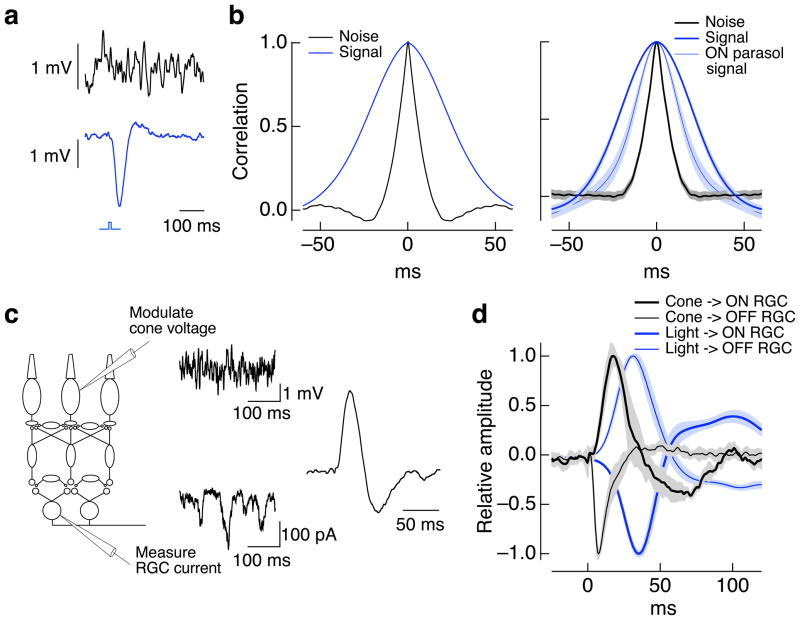
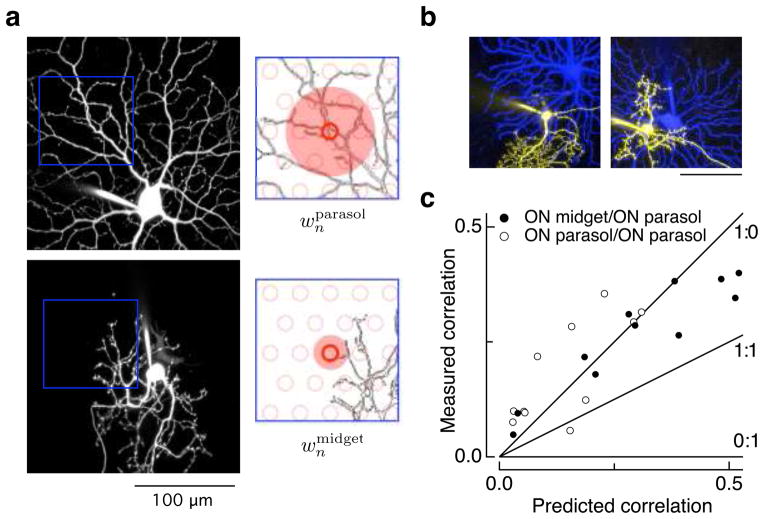
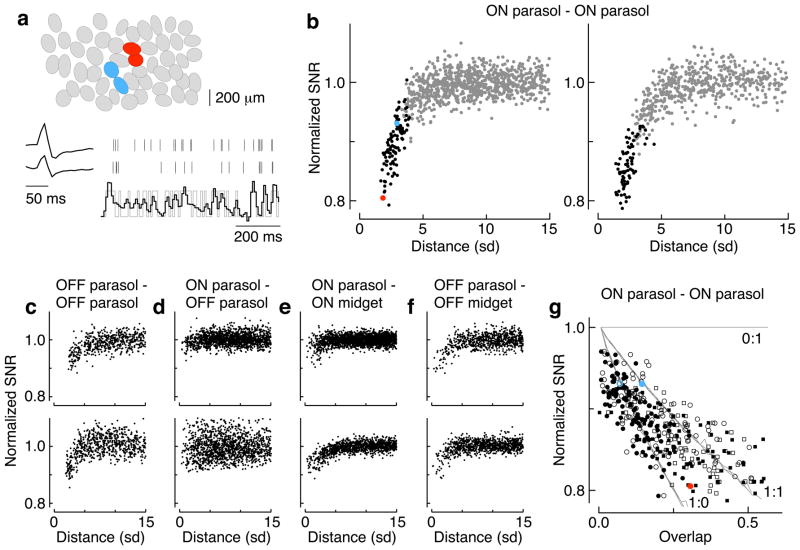
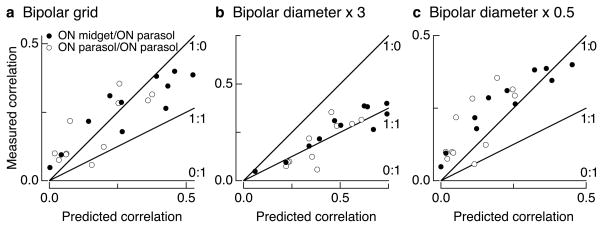
Transduction and synaptic noise generated in retinal cone photoreceptors determine the fidelity with which light inputs are encoded, and the readout of cone signals by downstream circuits determines whether this fidelity is used for vision. We examined the effect of cone noise on visual signals by measuring its contribution to correlated noise in primate retinal ganglion cells. Correlated noise was strong in the responses of dissimilar cell types with shared cone inputs. The dynamics of cone noise could account for rapid correlations in ganglion cell activity, and the extent of shared cone input could explain correlation strength. Furthermore, correlated noise limited the fidelity with which visual signals were encoded by populations of ganglion cells. Thus, a simple picture emerges: cone noise, traversing the retina through diverse pathways, accounts for most of the noise and correlations in the retinal output and constrains how higher centers exploit signals carried by parallel visual pathways.


Figures

Figure 1
Figure 1
Covariation of excitatory inputs to cells that share little known circuitry. a. Simultaneous recordings of excitatory synaptic inputs to an ON and an OFF parasol ganglion cell during modulated and constant light (top trace; 50% contrast, mean 4000 R*/cone/sec). Holding potentials were ~−70 mV. b. Crosscorrelation functions for the excitatory synaptic inputs measured during constant light (excluding 500 ms following the end of modulate light period; see Methods) from the same cell pair as a (left) and averaged across 9 cell pairs (right; mean ± SEM). c, d. Correlations in excitatory synaptic inputs to ON midget and ON parasol ganglion cells as in a and b (n = 18). e, f. Correlations in excitatory synaptic inputs to horizontal cells and ON parasol ganglion cells as in a and b (n = 5). Recordings for a–d were in flat mount preparations, and those in e and f were in slice preparations.
Figure 2
Figure 2
Effect of APB and mixture of LY341495 and APB on light responses of ON parasol ganglion cells. a. Example of titration of mixture of LY341495 and APB to match the holding current without drugs. Open circles plot current in constant light (4000 R*/cone/sec) while holding the cell near the reversal potential for inhibitory synaptic input. The cell was superfused with solutions containing 7.5 μM LY341495 and 2.5 μM APB (ratio 1), 7.5 μM LY341495 and 5 μM APB (ratio 2) and 10 μM APB. b. Excitatory synaptic inputs to an ON parasol cell elicited by a decrement in light intensity from 4000 to 0 R*/cone/sec for 500 ms. Increases in light intensity generated large excitatory inputs in control conditions. APB decreased the holding current by suppressing tonic excitatory input, eliminated the response to increases in light intensity, and unmasked a large response to decreases in light intensity. A mixture of LY and APB almost entirely suppressed increases in excitatory input for both decreases and increases in light intensity while also matching the holding current in control conditions. Much of the current change remaining in LY/APB likely reflects OFF pathway derived presynaptic inhibition, which decreases bipolar cell glutamate release. c. Collected data from 6 cells as in a, plotting the maximum light-evoked inward current at light onset (ON) and offset (OFF).
Figure 3
Figure 3
Correlated and total noise in ganglion cell excitatory synaptic inputs are dominated by cone noise. a. Simultaneous recordings of excitatory synaptic input to an ON parasol (top) and an ON midget (bottom) ganglion cell before (left) and during (right) superfusion with a mix of 7.5 μM LY341495 and 4 μM APB. Dashed line shows the mean current level in constant light (4000 R*/cone/sec) prior to exposure to the drugs. b. Crosscorrelation functions measured during constant light before (black) and during (red) LY/APB for the same cell pair as a. c. Peak crosscorrelation before LY/APB exposure plotted against that during LY/APB for 6 ON parasol/ON midget cell pairs. Also shown are peak crosscorrelations for 5 OFF parasol pairs as a control; correlations were measured from the residuals during modulated light to minimize the effects of nonlinearities in the OFF circuitry (see Methods and ref. 26). d. Current variance from 0–100 Hz measured in ON parasol ganglion cells during control conditions plotted against that in LY/APB (including some recordings from single cells not in c). e. Mean currents during control conditions and LY/APB for the cells in d. The mean current in control conditions was 1.05 ± 0.10 times that in LY/APB.
Figure 4
Figure 4
Rapid fluctuations in cone voltage are conveyed to ganglion cells. a. Cone voltage fluctuates more rapidly than the light response. Brief section of voltage fluctuations during constant light (top) and average response to a 10 ms flash (bottom) of a current-clamped cone. Recordings were made at a mean light level of 4000 R*/cone/sec. b. (left) Autocorrelation function of noise and light response for the same cone as in a. (right) Average autocorrelation functions for 5 cones. For comparison, the autocorrelation function of the light-evoked response of ON parasol cells is also plotted; its narrower width when compared to the cone light response indicates substantial high-pass filtering in the retinal circuitry. c. Measurement of kinetics of signal transfer from cones to ganglion cells. The voltage of a single cone was modulated randomly while measuring the resulting variations in excitatory synaptic input to an ON parasol ganglion cell. The cone voltage modulations shown have been filtered for illustration to make the slower modulations more apparent. The kinetics of signal transfer were estimated by calculating the filter that provides the best linear estimate of the ganglion cell currents given the cone voltage (right). d. Average filters for paired recordings between cones and OFF parasol cells (n = 4) and cones and ON parasol cells (n = 4). The filters predicting the ganglion cell currents from the light inputs are shown for comparison (based on 9 recordings from ON/OFF parasol pairs). The opposite polarity of the cone→RGC and light→RGC filters are expected because increases in light input hyperpolarize rather than depolarize the cones.
Figure 5
Figure 5
Dendritic overlap predicts correlation strength. a. Maximum-points projections of confocal images of parasol (top left) and midget (bottom left) ganglion cells. The images cover the same region of space but have been separated for clarity. The right panels show discretized regions of the dendrites with a model of the cone array (open red circles) overlaid. The weight of a given cone input to each ganglion cell was estimated from the length of dendrite within an area around the cone determined by the size of the axon terminals of the diffuse and midget cone bipolar cells (shaded red regions) that convey cone signals to parasol and midget ganglion cells. b. Midget-parasol ganglion cell pairs with low (left) and high (right) dendritic overlap. c. Relation between measured strength of correlated variability in excitatory inputs to midget and parasol ganglion cell pairs (as in Figure 1) and predicted correlation based on model outlined in a. Open circles show same analysis for ON parasol pairs. Lines show the expected dependence of correlation strength on overlap for models with different ratios of shared and independent noise as indicated in the labels (shared:independent). Recordings were made at a mean light level of 4000 R*/cone/sec.
Figure 6
Figure 6
Shared noise limits fidelity of neural coding in populations of ganglion cells. a. Ovals in the top panel represent Gaussian approximation of the receptive fields of simultaneously-recorded ON parasol cells. Pairs of parasol cells were used to reconstruct a time-varying, spatially uniform light input (gray trace, bottom). The spike response of each cell was convolved with an appropriate linear filter and the output summed to generate the reconstruction (black trace). Cell pairs in red and blue are highlighted in b and g. b. Dependence of signal-to-noise ratio (SNR) of the reconstruction on distance between the two cells, measured in units of the receptive field radius (SD, see top panel in a). The SNR is normalized so that pairs of cells that sample independent noise reach a value of one, as determined in distant cell pairs. Neighboring cell pairs are in black. Red and blue points represent cell pairs in a. The two panels are two different preparations. c–f. Analysis as in b for combinations of parasol and midget cells in two preparations. g. Dependence of SNR on receptive field overlap for ON parasol pairs. Lines show the expected dependence of SNR on overlap for models with different ratios of shared to independent noise. Closed symbols show overlap measured by correlating each pixel of raw receptive field measurements; open symbols show overlap estimated from Gaussian receptive field fits. Red and blue points represent cell pairs in a. Circles and squares represent different preparations from b. The mean light level was 1200 R*/cone/sec.
Figure 7
Figure 7
Dependence of predicted correlation strength on model parameters. Each panel compares predicted and measured correlation strength as in Figure 5c. a. Model in which bipolar cells are arranged on a grid and cones provide input to closest bipolar cells. All other parameters as in Figure 5c. b. Model in which bipolar cells spread signals over a 81 (27) μm radius disc for the diffuse (midget) cone bipolar cells. c. Model in which bipolar signal spread was 13.5 (4.5) μm for the diffuse (midget) cone bipolar cells.

References

    1. Mollon JD, Astell S, Cavonius CR. A reduction in stimulus duration can improve wavelength discriminations mediated by short-wave cones. Vision Res. 1992;32:745–755. - PubMed
    1. Westheimer G. Visual hyperacuity. Prog Sens Physiol. 1981;1:1–30.
    1. BARLOW HB. Purkinje shift and retinal noise. Nature. 1957;179:255–256. - PubMed
    1. Donner K. Noise and the absolute thresholds of cone and rod vision. Vision Res. 1992;32:853–866. - PubMed
    1. Barlow HB. Retinal noise and absolute threshold. J Opt Soc Am. 1956;46:634–639. - PubMed

Publication types

MeSH terms

Substances