. 2011 Sep 18;13(10):1224-33.
doi: 10.1038/ncb2330.

Bcl-xL regulates metabolic efficiency of neurons through interaction with the mitochondrial F1FO ATP synthase

Affiliations

Bcl-xL regulates metabolic efficiency of neurons through interaction with the mitochondrial F1FO ATP synthase

Kambiz N Alavian et al. Nat Cell Biol. .

Erratum in

  • Nat Cell Biol. 2011 Nov;13(11):1383

Abstract

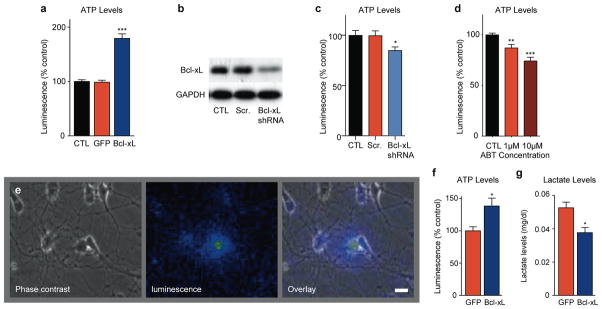
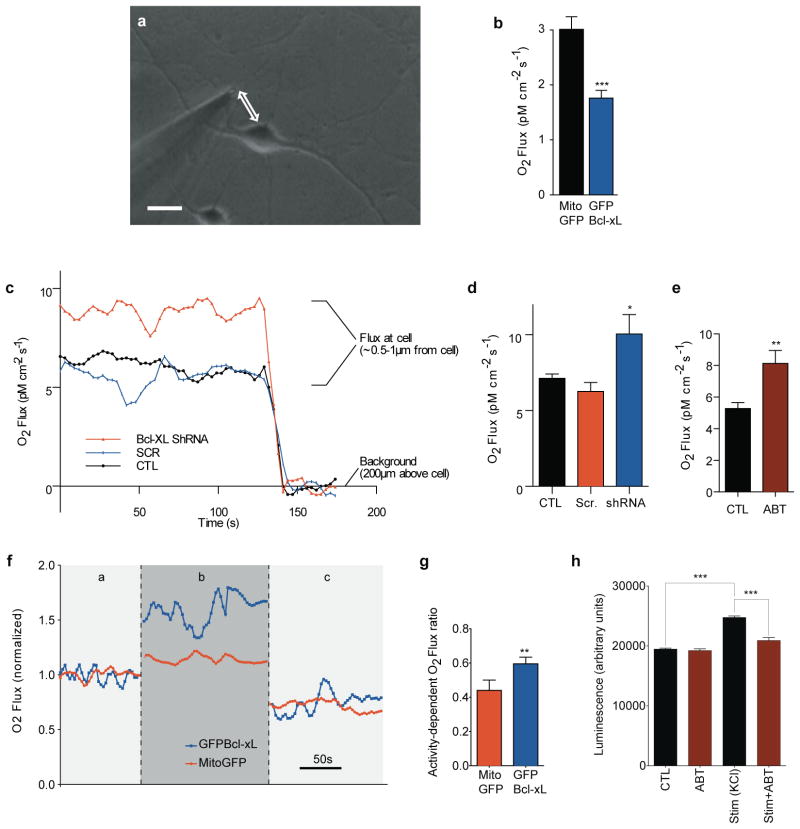
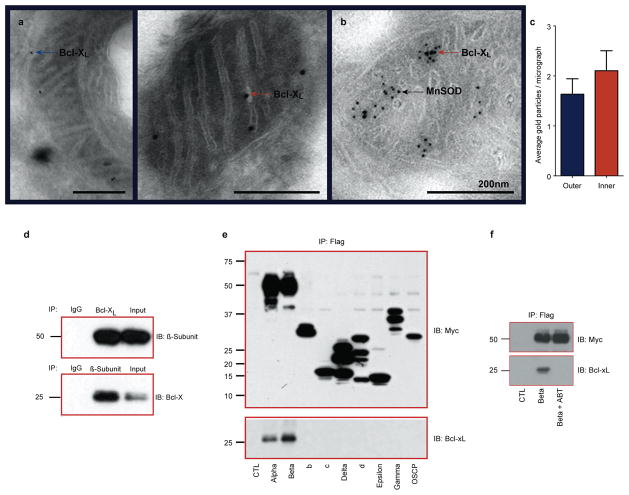
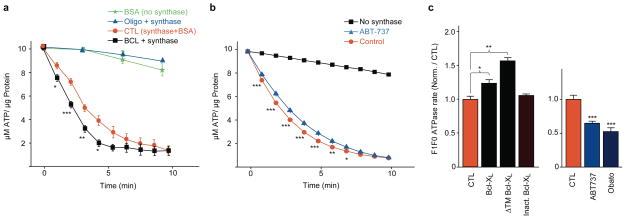
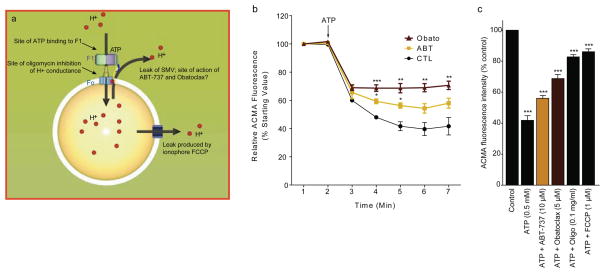
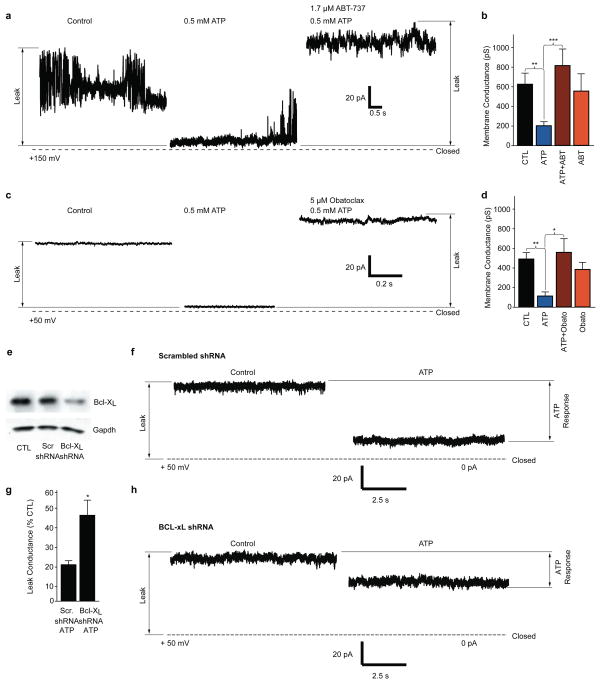
Anti-apoptotic Bcl2 family proteins such as Bcl-x(L) protect cells from death by sequestering apoptotic molecules, but also contribute to normal neuronal function. We find in hippocampal neurons that Bcl-x(L) enhances the efficiency of energy metabolism. Our evidence indicates that Bcl-x(L)interacts directly with the β-subunit of the F(1)F(O) ATP synthase, decreasing an ion leak within the F(1)F(O) ATPase complex and thereby increasing net transport of H(+) by F(1)F(O) during F(1)F(O) ATPase activity. By patch clamping submitochondrial vesicles enriched in F(1)F(O) ATP synthase complexes, we find that, in the presence of ATP, pharmacological or genetic inhibition of Bcl-x(L) activity increases the membrane leak conductance. In addition, recombinant Bcl-x(L) protein directly increases the level of ATPase activity of purified synthase complexes, and inhibition of endogenous Bcl-x(L) decreases the level of F(1)F(O) enzymatic activity. Our findings indicate that increased mitochondrial efficiency contributes to the enhanced synaptic efficacy found in Bcl-x(L)-expressing neurons.


Conflict of interest statement

Competing financial interests

The authors declare no competing financial interests.

Figures

Figure 1
Figure 1. Cellular ATP levels are altered by Bcl-xL over-expression or depletion in hippocampal neurons
a. ATP levels as measured by firefly Luciferin;luciferase luminescence at 7 days after transduction with lentivirus constructs. Luminescence level was normalized to protein level in each individual well, N= 8 wells, ***p < 0.0001). At least three independent experiments of different cultures showed similar results. b. Western blot for endogenous Bcl-xL protein. Cell lysates prepared from non-transduced control hippocampal neuron cultures (CTL), scrambled shRNA expressing neuron cultures and Bcl-xL shRNA expressing neuron cultures at 4 days after viral transduction. GAPDH serves as a loading control. c. ATP levels as measured by firefly Luciferin;luciferase luminescence in control cultures or cultures expressing Bcl-xL shRNA or scrambled shRNA at 4 days after viral transduction. Luminescence level was normalized to protein level in each individual well (N=11 for each condition, representing two independent cultures; *p<0.03). d. ATP levels as measured by firefly Luciferin;luciferase luminescence in control cultures or cultures exposed for 12–18hrs to ABT-737 at the indicated concentrations. Luminescence level was normalized to protein level in each individual well (N=15 for each condition, **p<0.004 ***p<0.0001, three independent cultures). e. Example image of a neuron expressing CSCW2-Luciferase lentiviral vector. Light is produced in response to application of 1mM luciferin. Shown are phase, luminescent and overlay images. In pseudocolor images, blue is low luminescence, yellow is high luminescence. Scale bar: 20μm. f. Group data for amount of ATP represented by luminescence per coverslip of living hippocampal neurons at 7 days after transfection with indicated constructs. Light levels were normalized to average of light levels in mito-GFP control cells. Living neurons were transfected with CSCW2-luciferase-IG lentivirus vector and mito-GFP or GFP-Bcl-xL (N= 8 coverslips from at least three independent cultures for mito-GFP-expressing neurons, N=10 coverslips from at least three independent cultures of GFP-Bcl-xL expressing neurons, * P < 0.02). g. Lactate levels in medium surrounding GFP-Bcl-xL expressing neurons compared to GFP expressing controls after 12hrs in physiological (5mM) glucose medium (one culture, N=3 replicates for each condition *p< 0.02). For all panels error bars indicate SEM.
Figure 2
Figure 2. Bcl-xL alters oxygen uptake by neurons. Resting Bcl-xL over-expressing and Bcl-xL depleted neurons have altered oxygen uptake
a. Photomicrograph of self-referencing amperometric O2 microsensor positioned next to a single hippocampal neuron. Scale bar: 20μm. b. Group data for basal respiration in GFP- Bcl-xL expressing neurons compared with Mito-GFP expressing neurons at 7 days after transfection (N=28 Mito-GFP expressing neurons, N=26 GFP- Bcl-xL expressing neurons; ***p<0.0005). Experiment was repeated in 5 different cultures from 5 different animals. c. Representative traces of oxygen flux levels of single neurons. For neuronal flux measurements, self-referencing amperometric O2 microsensor was placed within 1μm of the cell surface. For background measurement, electrode was moved 200μm from the cell surface. d. Group data for basal respiration levels of single non-expressing neurons, or neurons expressing Bcl-xL shRNA or scrambled shRNA at 7 days after viral transduction (N=10 replicates for CTL and Bcl-xL shRNA, N=9 replicates for scrambled shRNA, at least three independent cultures were used for studies; *p<0.05). e. Group data for basal respiration levels of single control neurons or neurons exposed for 18hrs to 10μM ABT-737 (N=26 for control and 19 for ABT-737; **p< 0.002; at least three different cultures for each group). f. Representative traces of oxygen flux levels of single neurons expressing Bcl-xL-GFP or mito-GFP, while resting (a), stimulated with 90mM KCl (b) and after addition of 5mg/ml oligomycin (c). All values were normalized against the average oxygen flux of the same neuron at resting flux level. g. Group data for the oxygen flux of single cultured neurons expressing Bcl-xL-GFP or mito-GFP. Leak-subtracted oxygen flux was divided by peak oxygen flux measured during neuronal activity [ratio = (b-c)/b]. Neurons were studied from four independent cultures (N=9 Mito-GFP control neurons, N=12 GFP-Bcl-xL expressing neurons, *p<0.04). h. Luminescence of firefly luciferase in cultured hippocampal neurons exposed or not to 1μM ABT-737 for 5min. and subsequently stimulated with 90mM KCl for 90s (N=12 wells per group; ***p<0.0001; two different cultures for each condition). Measurement of stimulated wells was taken 5min. after washout of high K. For all panels error bars indicate SEM.
Figure 3
Figure 3. Bcl-xL is expressed in the mitochondrial inner membrane and interacts with ATP synthase
a. Immuno-electron micrographs from cultured neurons over-expressing Bcl-xL at 7 days after viral transduction. Bcl-xL immunoreactivity in the outer membrane (left panel, arrow) and the inner membrane cristae (right panel, arrow) are shown. Scale bars: 200nm. b. Immuno-EM prepared from untreated rat brain (large balls: Bcl-xL; small balls: MnSOD). c. Average number of immunogold particles per electron micrograph representing Bcl-xL protein in the outer vs. inner membrane (N=30 micrographs). Error bars indicate SEM. d. Reciprocal immunoblots of co-immunoprecipitation of Bcl-xL and ATP synthase beta-subunit from purified rat brain ATP synthase complex. Antibodies are as indicated (IB) (N=3). Top lane: the precipitating antibodies were IgG and Bcl-xL. The top right lane represents the whole cell lysate. Bottom lane: the precipitating antibodies were IgG and ATP synthase beta subunit. The bottom right lane represents the whole cell lysate. e. Immunoprecipitation of the Myc-Flag-tagged ATP synthase subunits (Alpha, Beta, b, c, Delta, D, Epsilon, Gamma, and Oscp), precipitated using the anti-Flag affinity gel and immunoblotted using anti-myc tag antibody (upper panel). (Lower panel): Western blot analysis, using anti-Bcl-xL antibody, on the immunoprecipitated samples. f. Immunoprecipitation of the Myc-Flag-tagged ATP synthase subunit Beta, precipitated using the anti-Flag affinity gel and immunoblotted using anti-myc tag antibody (upper panel). Cells were pre-exposed for 12hr to 1μM ABT-737 or vehicle. (Lower panel): Western blot analysis, using anti-Bcl-xL antibody on the immunoprecipitated samples.
Figure 4
Figure 4. Bcl-xL protein regulates ATPase activity
a. Luminescence of firefly Luciferin;luciferase activity in the presence of ATP. N=3 wells without F1FO ATP synthase (blank); N=3 wells F1FO ATP synthase plus the FO inhibitor oligomycin (5mg/ml); N=6 wells synthase plus recombinant Bcl-xL protein (0.045–0.79mg protein/ml); N=9 wells synthase plus control protein (0.05mg/ml BSA, F1FO ATP synthase concentration for all experiments was 4mg protein/ml). *p < 0.05, **p < 0.005, ***p<0.0005. Experiments on Bcl-xL vs. control were repeated and confirmed on 5 different experimental days using at least two different F1FO ATPase vesicle preparations (from two different animals). b. F1FO ATPase activity of purified F1FO ATP synthase in the absence and presence of ABT-737 (20μM). Data are displayed as percent change in fluorescence over time (N=3 for each condition; ***p< 0.0008, **p<0.003, *p<0.04). Experiments were repeated on three independent isolations with similar results. c. F1FO ATPase activity of the purified F1FO ATP synthase vesicles in the presence of the indicated recombinant proteins or reagents as a function of the rate of decrease in NADH fluorescence (see Methods). (Left panel) N=3 samples in each condition, **p<0.002,*p<0.04, assay performed with similar results on two independent F1FO ATP synthase isolations. (Right panel) N=7 samples for each condition, assay performed with similar results on two independent isolations***p<0.0001. For all panels error bars indicate SEM.
Figure 5
Figure 5. ATP-sensitive H+ ion sequestration into F1FO ATPase vesicles (SMVs) is attenuated by Bcl-xL inhibitors, and by oligomycin and FCCP
a. Arrangement of F1FO ATPase vesicle exposed to the fluorescent pH indicator, ACMA. ATP binds to F1 to activate ATP hydrolysis and drives H+ ions through FO, decreasing ACMA fluorescence. Bcl-xL inhibitors produce an H+ leak out of the F1FO ATPase membrane, perhaps at the site of the F1FO ATPase itself, resulting in an increase in ACMA fluorescence. Oligomycin blocks movement of H+ ions through the FO, and thus prevents a drop in ACMA fluorescence. FCCP is an H+ ionophore that causes the leakage of H+ out of the SMV. b. Example traces of fluorescence changes of ACMA indicator over time in the presence of F1FO ATPase vesicles (N=3 samples for each condition, repeated three times. Comparing effects of reagents in the presence of ATP to the effect of ATP alone, * p < 0.05; ** p < 0.01; ***p < 0.0001, one-way ANOVA). c. Group data showing peak effect on relative fluorescence (% control). Control represents fluorescence of ACMA indicator in the presence of SMVs before the addition of ATP (N=3 samples for each group. * p < 0.05; ***p<0.0001, one-way ANOVA. This study was repeated at least three times on different batches of SMVs with similar results. Error bars indicate SEM.
Figure 6
Figure 6. Pharmacological inhibition or depletion of Bcl-xL reverse leak closure in patch clamp recordings of isolated ATP F1FO ATPase vesicles
a. Example SMV patch recording at the indicated voltage before and after ATP and ATP+ABT-737 exposure. Dotted line represents 0pA. b. Group data of membrane conductances of all recordings such as shown in a (SMV recordings from left to right, N=30, 23, 19, 7; **p< 0.002, ***p<0.0009). The last histogram shows experiments in which the Bcl-xL inhibitor was added to patches in the absence of ATP. c. Example SMV patch recording at the indicated voltage before and after ATP and ATP+Obatoclax exposure. Dotted line represents 0 pA. d. Group data of membrane conductances of all recordings such as shown in c (SMV recordings from left to right, N=23, 9, 15, 14; **p< 0.004, *p<0.04). The last histogram shows experiments in which the Bcl-xL inhibitor was added to patches in the absence of ATP. e. Western blot for endogenous Bcl-xL protein. Cell lysates prepared from non-transduced control hippocampal neuron cultures (CTL), scrambled shRNA expressing neuron cultures and Bcl-xL shRNA expressing neuron cultures at 4 days after transduction. Protein concentration was controlled by immunoblotting for GAPDH. f. SMV patch recordings before and after the addition of 0.5mM ATP. SMVs were prepared from hippocampal neurons expressing control (scrambled) shRNA at 4 days after transduction. g. Group data from all recordings of control (scrambled) shRNA or Bcl-xL shRNA. Shown is the membrane leak conductance remaining after the addition of ATP as a percent of the initial conductance before the addition of ATP (N=5 control recordings, N=7 shRNA Bcl-xL recordings; *p< 0.03). h. SMV patch recordings before and after the addition of ATP. SMVs were prepared from hippocampal neurons expressing Bcl-xL shRNA at 4 days after transduction. For all panels error bars indicate SEM.

References

    1. Banasiak KJ, Xia Y, Haddad GG. Mechanisms underlying hypoxia-induced neuronal apoptosis. Progress in Neurobiology. 2000;62:215–249. - PubMed
    1. Youle RJ, Strasser A. The BCL-2 protein family: opposing activities that mediate cell death. Nat Rev Mol Cell Biol. 2008;9:47–59. - PubMed
    1. Fannjiang Y, et al. BAK alters neuronal excitability and can switch from anti- to pro-death function during postnatal development. Developmental Cell. 2003;4:575–585. - PubMed
    1. Kim H, et al. Hierarchical regulation of mitochondrion-dependent apoptosis by BCL-2 subfamilies.[see comment] Nature Cell Biology. 2006;8:1348–1358. - PubMed
    1. Wang C, Youle RJ. The role of mitochondria in apoptosis*. Annu Rev Genet. 2009;43:95–118. - PMC - PubMed

Publication types

MeSH terms