

doi: 10.1021/jp206157v.
A Three-Channel Spectrometer for Wide-Field Imaging of Anisotropic Plasmonic Nanoparticles
Affiliations
- PMID: 21927639
- PMCID: PMC3171732
- DOI: 10.1021/jp206157v
Item in Clipboard
A Three-Channel Spectrometer for Wide-Field Imaging of Anisotropic Plasmonic Nanoparticles
J Phys Chem C Nanomater Interfaces.
.
Abstract
A three-channel spectrometer (3CS) based on a commercial digital camera was developed to distinguish among tens of large (>100 nm), anisotropic plasmonic particles with various shapes, orientations, and compositions on a surface simultaneously. Using band pass filters and polarizers, the contrast of 3CS images could be enhanced to identify specific orientation and composition characteristics of gold and gold-silver nanopyramids and as well as the direction of the longest arm of gold nanostars.
Figures
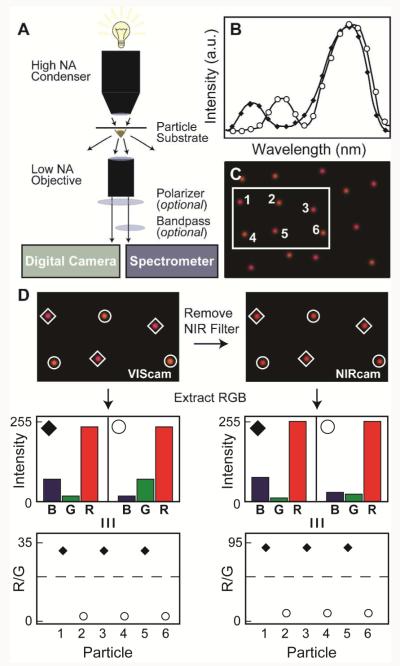
(A) DF scattering setup. (B) Simulation of single-particle scattering spectra of two different anisotropic particles (indicated by ◆ and ○) with scattering intensities that are similar at longer wavelengths but different at shorter wavelengths. (C) Simulation of a wide-field image of two different anisotropic particles (◆ and ○). (D) RGB channel intensities from the VIScam and NIRcam images using MATLAB. The histograms demonstrate the relative RGB intensities for the two types of particles.
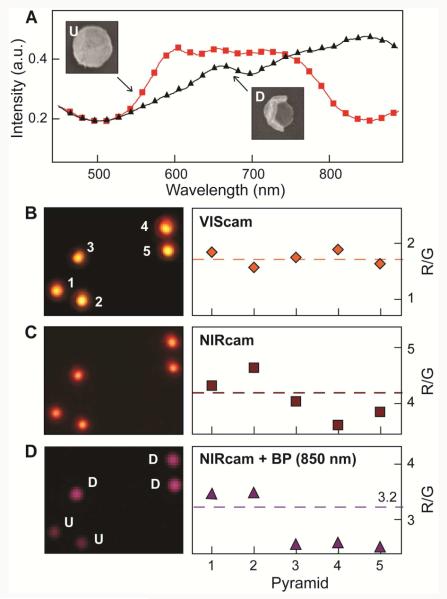
(A) Single-particle spectra of Au nanopyramids (d = 350 nm, t = 20 nm) with a tip-up (U) ( ) and tip-down (D) (▲) orientation. (B) VIScam image and R/G values for five Au pyramids. The particles scatter very similar colors and have very similar R/G values. (C) NIRcam image and R/G values for the same image in (B). The particles still scatter very similar colors, although the R/G values for pyramids 1 and 2 begin to separate from pyramids 3, 4, 5. (D) NIRcam image with 850 nm (± 20 nm) BP filter and R/G values for the same image in (B). The R/G values separate into two distinct regions that correspond to U and D. The threshold value was set at 3.2. All optical images are 12 μm × 9.3 μm.
) and tip-down (D) (▲) orientation. (B) VIScam image and R/G values for five Au pyramids. The particles scatter very similar colors and have very similar R/G values. (C) NIRcam image and R/G values for the same image in (B). The particles still scatter very similar colors, although the R/G values for pyramids 1 and 2 begin to separate from pyramids 3, 4, 5. (D) NIRcam image with 850 nm (± 20 nm) BP filter and R/G values for the same image in (B). The R/G values separate into two distinct regions that correspond to U and D. The threshold value was set at 3.2. All optical images are 12 μm × 9.3 μm.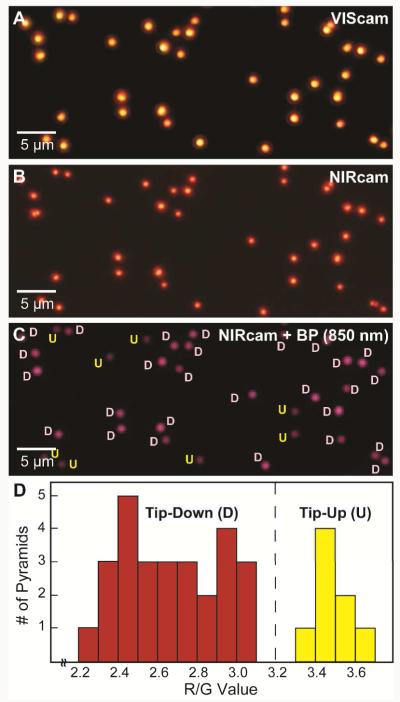
(A) VIScam image of thirty-five (d = 350 nm, t = 20 nm) nanopyramids. (B) NIRcam image of the same area. (C) NIRcam image of (B) with 850 nm (± 20 nm) BP with orientations identified based on a threshold of 3.2 from Figure 2. (D) Histogram of R/G from (C).
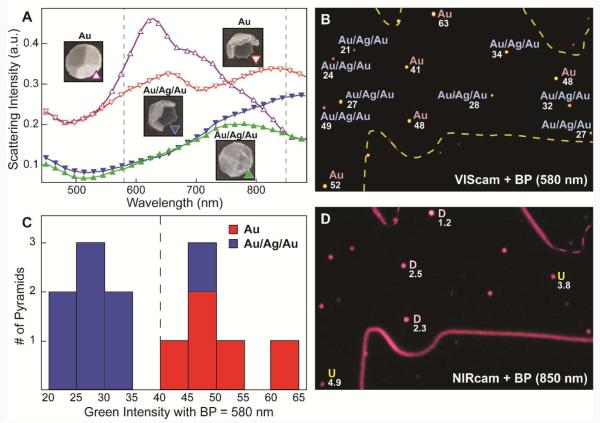
(A) Single-particle DF scattering spectra of Au (d = 350 nm, t = 40 nm) and Au/Ag/Au (d = 350 nm, t = 10/20/10 nm) pyramids. Spectra are offset for clarity. The dashed lines indicate the location of the BP filters (580 nm and 850 nm) used to refine the 3CS images. Insets: SEM images of Au and Au/Ag/Au pyramids in U and D orientations. Images are 400 nm × 400 nm. (B) VIScam image with a 580-nm BP filter, where the G-channel intensity for thirteen Au and Au/Ag/Au pyramids is shown. (C) Histogram of G intensities separate into two regions corresponding to either Au or Au/Ag/Au. (D) NIRcam image with 850-nm BF filter enables assignment of U and D for the Au pyramids.
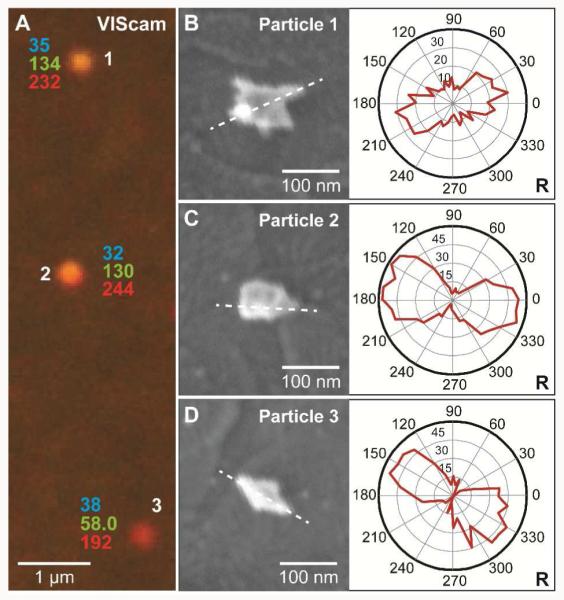
(A) VIScam image of three AuNSs and their RGB-channel intensities. (B-D) SEM images and polar plots for each AuNS. Dashed lines highlights the longest arm of each structure. Polar plots of R intensities from NIRcam and 850-nm BP filter were obtained every 10° from 0° to 360° (integration time of 30 s). The lobbed-feature correlates to a dipolar LSP resonance.
References
-
- Stephens DJ, Allan VJ. Science. 2003;300:82. - PubMed
-
- Penn SG, He L, Natan MJ. Curr. Opin. Chem. Biol. 2003;7:609. - PubMed
-
- Bohren C, Huffman DR, editors. Absorption and Scattering of Light by Small Particles. Wiley-VCH; New York: 1999.
-
- Jain P, Huang X, El-Sayed I, El-Sayed M. Plasmonics. 2007;2:107.
-
- Jain PK, Lee KS, El-Sayed IH, El-Sayed MA. J. Phys. Chem. B. 2006;110:7238. - PubMed
Grants and funding
LinkOut - more resources
Full Text Sources