Editorial
. 2011 Sep-Oct;24(5):471-9.
doi: 10.1111/j.1525-139X.2011.00979.x. Epub 2011 Sep 19.

Dialysis cannot be dosed

Editorial

Dialysis cannot be dosed

Timothy W Meyer et al. Semin Dial. 2011 Sep-Oct.

Abstract

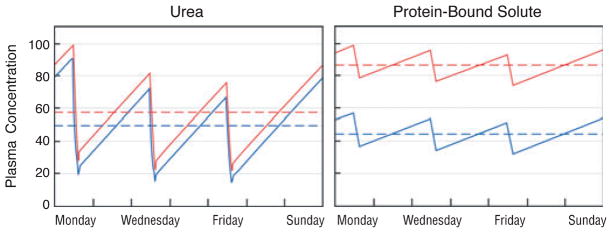
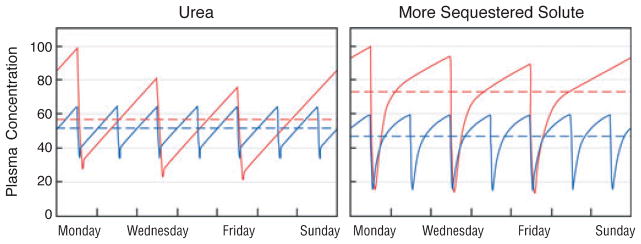
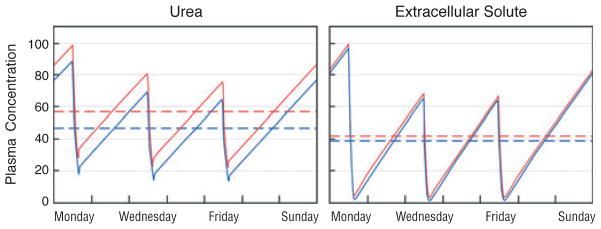
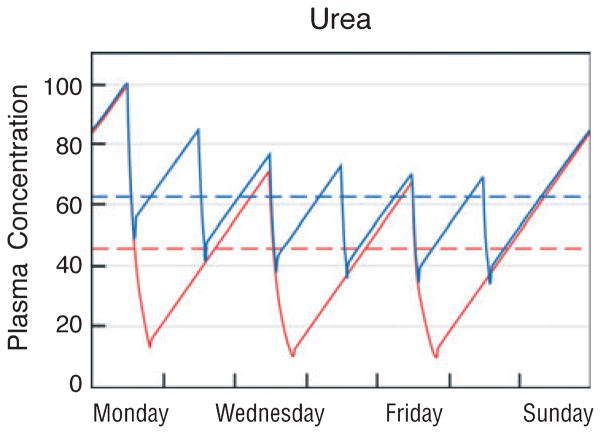
Adequate dialysis is difficult to define because we have not identified the toxic solutes that contribute most to uremic illness. Dialysis prescriptions therefore cannot be adjusted to control the levels of these solutes. The current solution to this problem is to define an adequate dose of dialysis on the basis of fraction of urea removed from the body. This has provided a practical guide to treatment as the dialysis population has grown over the past 25 years. Indeed, a lower limit to Kt/V(urea) (or the related urea reduction ratio) is now established as a quality indicator by the Centers for Medicare and Medicaid for chronic hemodialysis patients in the United States. For the present, this urea-based standard provides a useful tool to avoid grossly inadequate dialysis. Dialysis dosing, however, based on measurement of a single, relatively nontoxic solute can provide only a very limited guide toward improved treatment. Prescriptions which have similar effects on the index solute can have widely different effects on other solutes. The dose concept discourages attempts to increase the removal of such solutes independent of the index solute. The dose concept further assumes that important solutes are produced at a constant rate relative to body size, and discourages attempts to augment dialysis treatment by reducing solute production. Identification of toxic solutes would provide a more rational basis for the prescription of dialysis and ultimately for improved treatment of patients with renal failure.


Conflict of interest statement

Competing Financial Interest

The authors have no financial interests to disclose.

Figures

Fig. 1
Fig. 1
The predicted effect of increasing dialyzer size and dialysate flow on the plasma concentration of urea (left panel) as compared with a solute, which is 95% bound to plasma proteins (right panel). In the left panel, the red line depicts urea levels obtained with a conventional dialysis prescription designed to achieve single pool Kt/Vurea of 1.4 with a blood flow (Qb) of 360 ml/minute and a dialysate flow (Qd) of 500 ml/minute during a dialysis session lasting 3.5 hours. As depicted by the blue line, the predicted effect on urea levels of doubling both Qd and the mass transfer area coefficient KoA would be to reduce the time-averaged urea concentration by only about 15%. The reduction in time-averaged concentration (broken lines) is small because the urea clearance is a large fraction of the blood flow with the conventional prescription and the urea reduction ratio is already about 70%. The right panel depicts the effect of the same two prescriptions on plasma levels of a solute, which is 95% bound to plasma proteins. With the conventional prescription (red line), the clearance of the bound solute is less than a tenth that of urea and the solute reduction ratio is only about 20%. Doubling Qd and KoA would nearly double the clearance of the bound solute. If solute production stayed constant and the solute was cleared by no other route, this would reduce time-averaged concentration by almost 50% (blue line). Solute concentration profiles were obtained with a previously described computer program and using a distribution volume for the bound solute of 0.2 l/kg body weight, similar to the value observed by Martinez et al. (67). for p-cresol sulfate (68). The peak predialysis concentration has been set to 100 arbitrary units for both solutes.
Fig. 2
Fig. 2
The predicted effect of increasing dialysis frequency from three to seven times per week on the plasma concentration of urea (left panel) as compared with a more sequestered solute (right panel). In the left panel, the red line again depicts urea levels obtained with a conventional dialysis prescription designed to achieve single pool Kt/Vurea of 1.4 during a dialysis session lasting 3.5 hours. The blue line depicts the predicted effect on urea levels of dividing the same 10.5 hours of total treatment time into daily 1.5-hour sessions while leaving other elements of the prescription constant. The reduction in time-averaged concentration (broken lines) is only about 10%. The right panel depicts the effect of the same two prescriptions on levels of a hypothetical solute, which is distributed in a 12-l compartment including the plasma, which is readily accessible to the dialyzer and a second 36-l compartment with passive movement between the first and second compartments characterized by an inter compartmental diffusion coefficient of 40 ml/minute. With conventional thrice weekly treatment (red line), the latter part of each treatment removes relatively little solute because the solute concentration in the first, accessible compartment has already been reduced to low levels. The plasma concentration exhibits prominent rebound following the end of each treatment as the first compartment is refilled from the second. Daily treatment with the shorter sessions results in more effective solute removal with a predicted reduction in the time-averaged solute concentration of about 35% (blue line). Solute concentration profiles were obtained with a previously described computer program assuming constant rates of solute production and no solute clearance by other routes (68).
Fig. 3
Fig. 3
The predicted effect of increasing Kt/Vurea on the plasma concentration of urea (left panel) as compared with a small solute, which is distributed only in the extracellular fluid (right panel). In the left panel, the red line again depicts urea levels obtained with a conventional dialysis prescription designed to achieve single pool (sp)Kt/Vurea of 1.4 during a dialysis session lasting 3.5 hours. The blue line depicts the predicted effect on urea levels of increasing the urea clearance by 15% and the session length to 4 hours so that spKt/Vurea is increased by close to 30%. This increase is similar in magnitude to that achieved in the “high-dose” arm of the HEMO study (16). Its effect is to reduce time-averaged urea levels by about 18%. The right panel depicts the effect of the same two prescriptions on levels of a hypothetical small, unbound solute, which is distributed only in the extracellular fluid. As the clearance is high relative to the volume of distribution, the conventional prescription removes the solute almost completely. The increases in session length and clearance, which together provide a 30% higher “dose” of dialysis as measured by Kt/Vurea, reduce the time-averaged solute concentration by less than 10% (blue line). Solute concentration profiles were obtained with a previously described computer program assuming constant rates of solute production and no solute clearance by other routes (68).
Fig. 4
Fig. 4
The relationship of equilibrated Kt/Vurea or eKt/Vurea with single pool (sp)Kt/Vurea. Points A and B depict the measured plasma urea nitrogen concentrations at the beginning and end of a 3-hour dialysis session. If urea were removed from a single well-mixed compartment, the urea concentration would have fallen along the broken line and treatment, which produced the 73% urea reduction ratio depicted here, would be characterized by an spKt/Vurea of approximately 1.30. However, the true urea concentration curve is represented by the solid line, reflecting sequestration of urea. This curve dips below the theoretical single compartment curve during treatment, reflecting rapid removal of urea from a readily accessible first compartment. It rebounds after treatment as urea moves into the first compartment from a second compartment, which has been less effectively cleared, and then rises at a slower, steady rate reflecting urea generation. The effect on urea values through the week is the same as if urea had been removed from a single compartment at a lesser clearance so that its concentration fell along the dotted line to point C and then did not rebound. This theoretically equivalent treatment of a fully equilibrated single compartment could be characterized by an eKt/Vurea of approximately 1.13. Use of eKt/Vurea is required to compare urea removal during sessions of different lengths, as the urea rebound is greater after shorter sessions. Values for the reduction ratio presented here are approximations; values obtained for individual dialysis session would differ slightly depending on ultrafiltration and urea generation.
Fig. 5
Fig. 5
Comparison of the effect of two intensive dialysis prescriptions on plasma urea levels. The red line depicts the effect of a weekly total time of 24 hours divided into three treatments lasting 8 hours. The blue line depicts the effect of a total of 14 hours divided into six treatments lasting 2 hours and 20 minutes. The blood flow, dialysate flow, and dialyzer are presumed to be the same so that the urea clearance is the same. Frequent treatment for a shorter total time results in a higher time-averaged urea concentration (dashed line). However, the average of the peak pretreatment urea concentration values through the week is the same for both prescriptions, so that they would provide the same standard Kt/Vurea by one formulation of this parameter. It remains uncertain, however, that these two treatments would have the same clinical effect even independent of differences in extracellular volume and inorganic ion control.

References

    1. Hemodialysis Adequacy 2006 Work Group. Clinical practice guidelines for hemodialysis adequacy, update 2006. Am J Kidney Dis. 2006;48(Suppl 1):S2–S90. - PubMed
    1. Depner TA. Prescribing Hemodialysis: A Guide to Urea Modeling. Norwall, MA: Kluwer Academic Publishers; 1991.
    1. Lowrie EG, Laird NM, Parker TF, Sargent JA. Effect of the hemodialysis prescription of patient morbidity: report from the National Cooperative Dialysis Study. N Engl J Med. 1981;305:1176–1181. - PubMed
    1. Burton BT. Adequacy of dialysis. Introduction: purpose of the conference. Kidney Int. 1975;7(Suppl 2):S1. - PubMed
    1. Teschan PE. Electroencephalographic and other neurophysiological abnormalities in uremia. Kidney Int. 1975;7(Suppl 2):S210–S216. - PubMed

Publication types

MeSH terms