. 2011 Sep;65(9):1029-45.
doi: 10.1366/11-06302.

Infrared and visible absolute and difference spectra of bacteriorhodopsin photocycle intermediates

Affiliations

Infrared and visible absolute and difference spectra of bacteriorhodopsin photocycle intermediates

Richard W Hendler et al. Appl Spectrosc. 2011 Sep.

Abstract

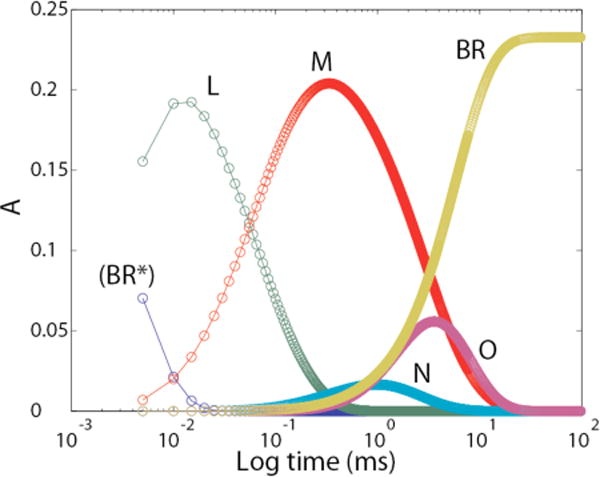
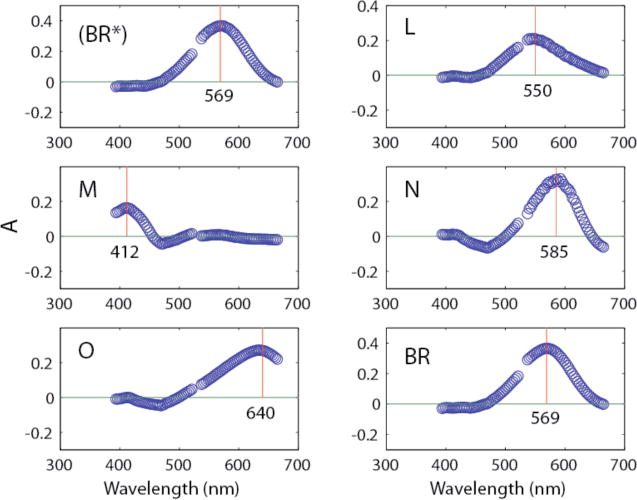
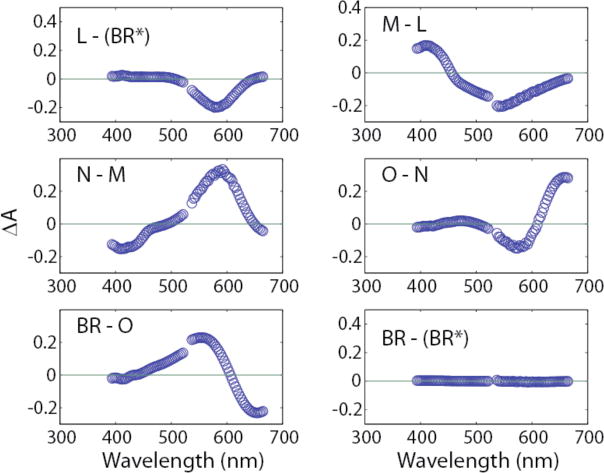
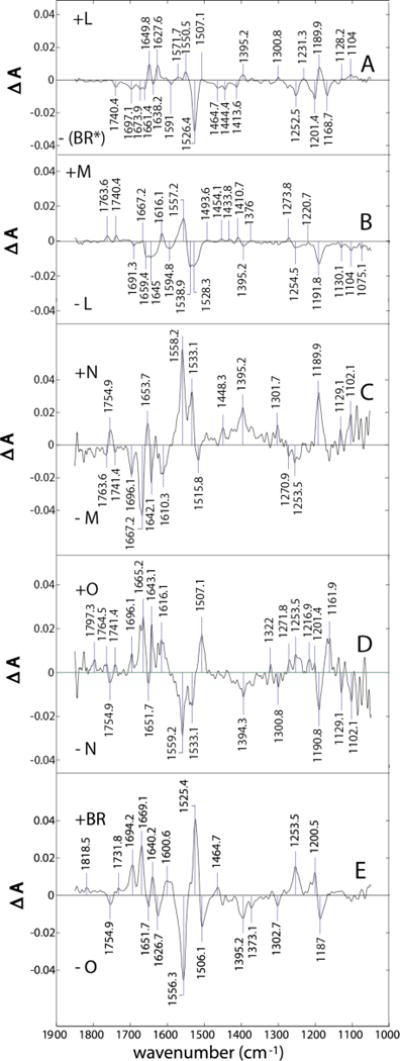
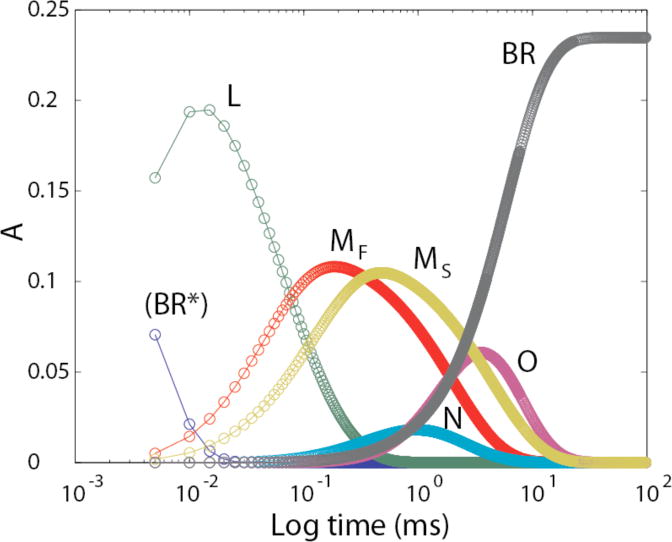
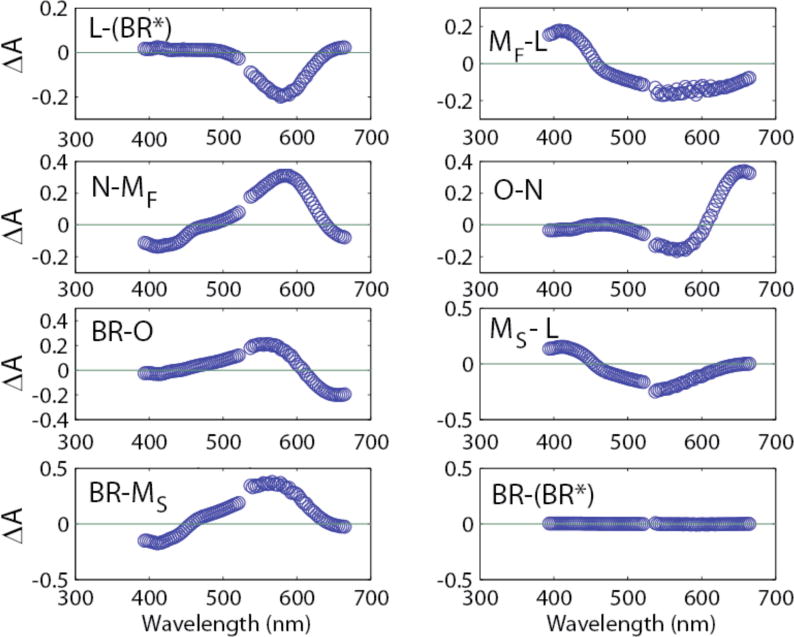
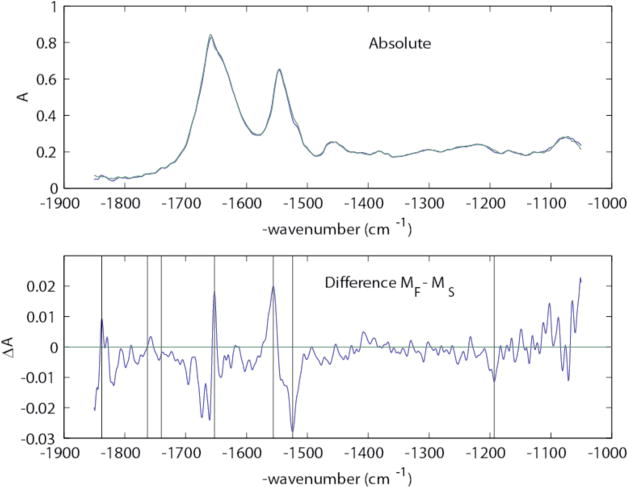
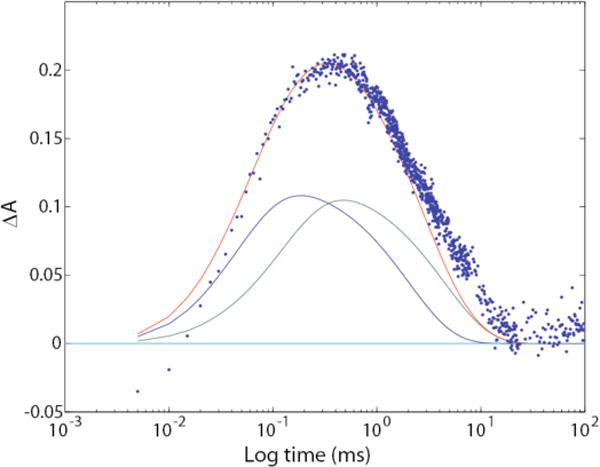
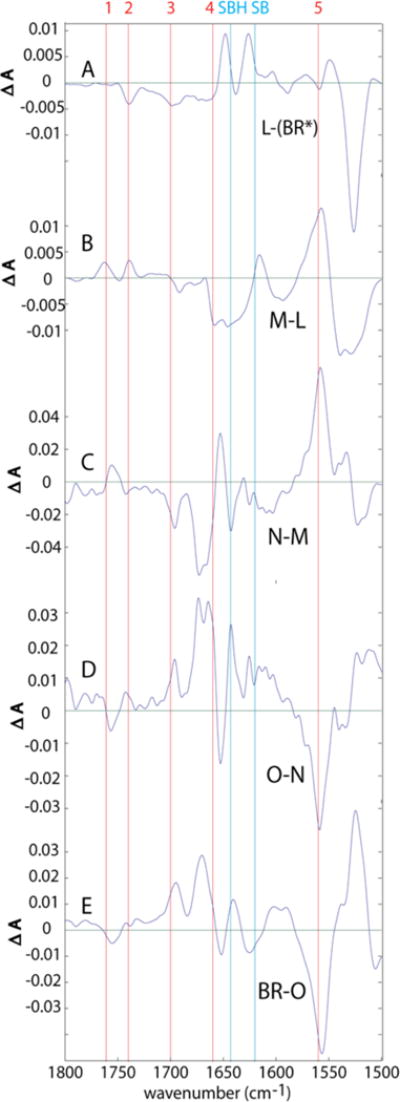
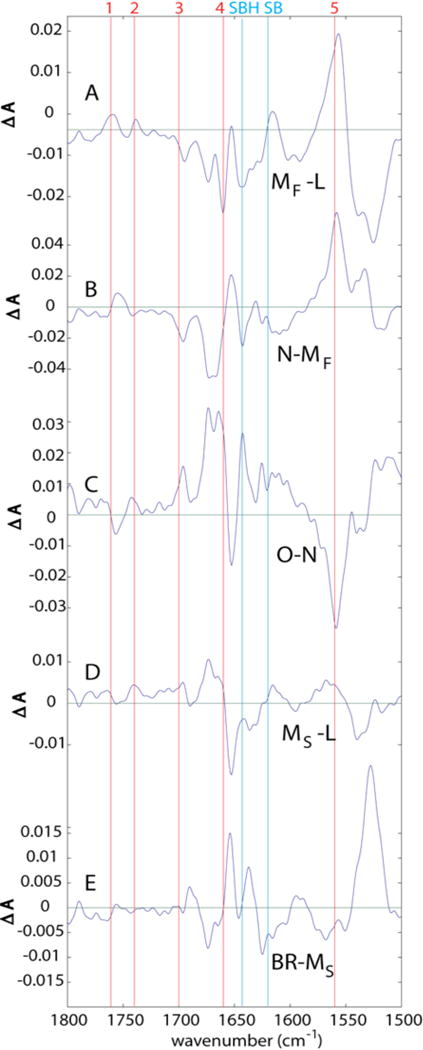
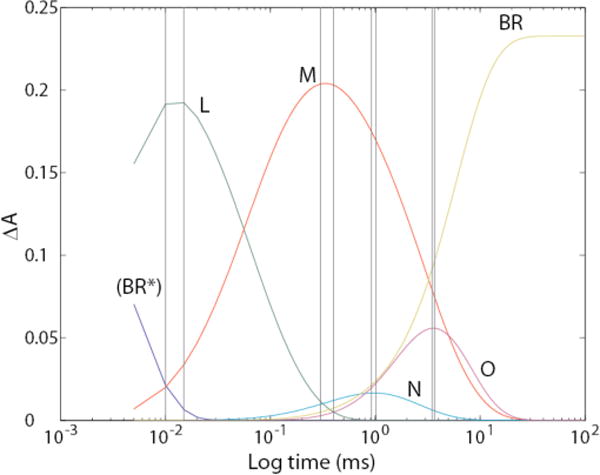
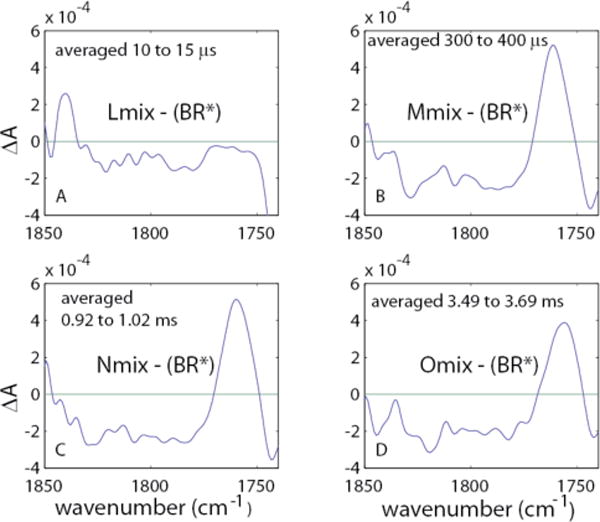
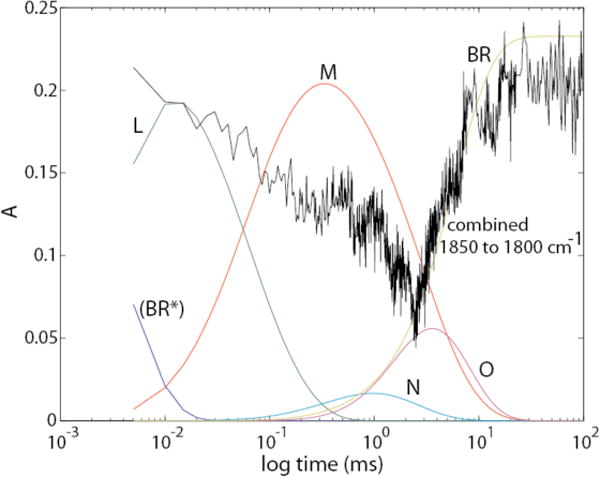
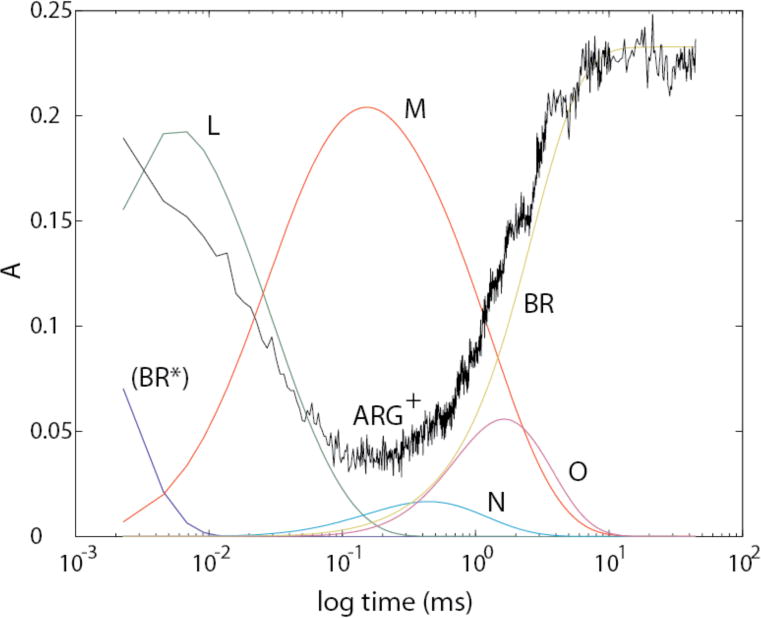
We have used new kinetic fitting procedures to obtain infrared (IR) absolute spectra for intermediates of the main bacteriorhodopsin (bR) photocycle(s). The linear-algebra-based procedures of Hendler et al. (J. Phys. Chem. B, 105, 3319-3228 (2001)) for obtaining clean absolute visible spectra of bR photocycle intermediates were adapted for use with IR data. This led to isolation, for the first time, of corresponding clean absolute IR spectra, including the separation of the M intermediate into its M(F) and M(S) components from parallel photocycles. This in turn permitted the computation of clean IR difference spectra between pairs of successive intermediates, allowing for the most rigorous analysis to date of changes occurring at each step of the photocycle. The statistical accuracy of the spectral calculation methods allows us to identify, with great confidence, new spectral features. One of these is a very strong differential IR band at 1650 cm(-1) for the L intermediate at room temperature that is not present in analogous L spectra measured at cryogenic temperatures. This band, in one of the noisiest spectral regions, has not been identified in any previous time-resolved IR papers, although retrospectively it is apparent as one of the strongest L absorbance changes in their raw data, considered collectively. Additionally, our results are most consistent with Arg82 as the primary proton-release group (PRG), rather than a protonated water cluster or H-bonded grouping of carboxylic residues. Notably, the Arg82 deprotonation occurs exclusively in the M(F) pathway of the parallel cycles model of the photocycle.


Figures

Figure 1
Figure 1
Time courses for photocycle intermediates according to the unitary cycle model shown in “Experimental Procedures”. The time courses for LF and LS were merged, as were those for MF and MS.
Figure 2
Figure 2
Isolated visible absolute spectra obtained from raw data using equation 2. The vertical lines indicate peak locations in nm as designated in the figure.
Figure 3
Figure 3
Transitional difference spectra obtained by subtraction of absolute spectra shown in Fig. 3. For example, the L-(BR*) spectrum is for the (BR*) ╜ L transition.
Figure 4
Figure 4
Difference spectra for (from top to bottom) the (BR*)╜L, L╜M, M╜N, N╜O, and O╜BR transitions.
Figure 5
Figure 5
Time courses for photocycle intermediates according to the parallel-cycle model shown in “Experimental Procedures”, with divided M intermediates but still a unitary L intermediate (LF and LS summed).
Figure 6
Figure 6
Isolated visible absolute spectra obtained from raw data using equation 2 and separate time courses for MF and MS. The vertical lines indicate peak locations in nm as designated in the figure.
Figure 7
Figure 7
Transitional difference spectra obtained by subtraction of the absolute spectra shown in Fig. 6. For example, the L-(BR*) spectrum is for the (BR*) ╜ L transition.
Figure 8
Figure 8
Upper panel: Absolute IR spectra for MF (blue) and MS (green). Lower panel: Difference spectrum between MF and MS, with vertical marker lines at 1838, 1763, 1740, 1654, 1556, 1524, and 1192 cm−1.
Figure 9
Figure 9
Comparison of time course for IR absorbance at 1763 cm−1 (blue dots) with the fitted visible (410 nm) time courses for MF (blue line), MS (green line), and combined MF and MS (red line), computed from the visible data by using the parallel-cycles model. The y-axis scale applies directly to the fitted visible data; the measured IR data were multiplied by 390 in order to superimpose them.
Figure 10
Figure 10
Transitional difference spectra (TDS) where “unitary” forms of L and M are used.
Figure 11
Figure 11
Transitional difference spectra (TDS) where separated MF and MS intermediates are used. The L-(BR*) and BR-O difference spectra in this case are identical to the top and bottom panels of Fig. 10, respectively, and are therefore not repeated.
Figure 12
Figure 12
Time courses, obtained from our data, for growth and decay of photocycle intermediates. The pairs of vertical lines show ranges where time samples were averaged.
Figure 13
Figure 13
Averaged continuum difference spectra relative to the ground state, using our data. The designations Lmix, Mmix, Nmix, and Omix refer to the fact that these spectra are not the pure spectrum of each intermediate, but contain the spectra of other intermediates as shown in Fig. 12.
Figure 14
Figure 14
The time course of integrated absorbances from 1850 cm−1 to 1800 cm−1, (black trace) has been scaled and superimposed on the time courses for the intermediates in the photocycle.
Figure 15
Figure 15
Transitional difference spectra for sequential conversions of L to M to N to O. The vertical red lines at 1761 cm−1 indicate the position for protonated Asp85 in the M intermediate. The panels on the left contain mixtures of intermediates as shown in Fig. 12.
Figure 16
Figure 16
The time course of integrated absorbances from 1655 cm−1 to 1665 cm−1 (black trace), attributable largely to protonated Arg82, has been scaled and superimposed on the time courses for the intermediates in the photocycle.

References

    1. Lanyi JK. Ann Rev Physiol. 2004;66:665. - PubMed
    1. Hendler RW. J Phys Chem B. 2005;109:16515. - PubMed
    1. Hendler RW, Shrager RI, Bose S. J Phys, Chem B. 2001;105:3319. - PubMed
    1. Kakareka JW, Smith PD, Pohida TJ, Hendler RW, Biochem J. Biophys Meth. 2008;70:1116. - PMC - PubMed
    1. Oesterhelt D, Stoeckenius W. Methods Enzymol. 1974;31:667. - PubMed

MeSH terms

LinkOut - more resources